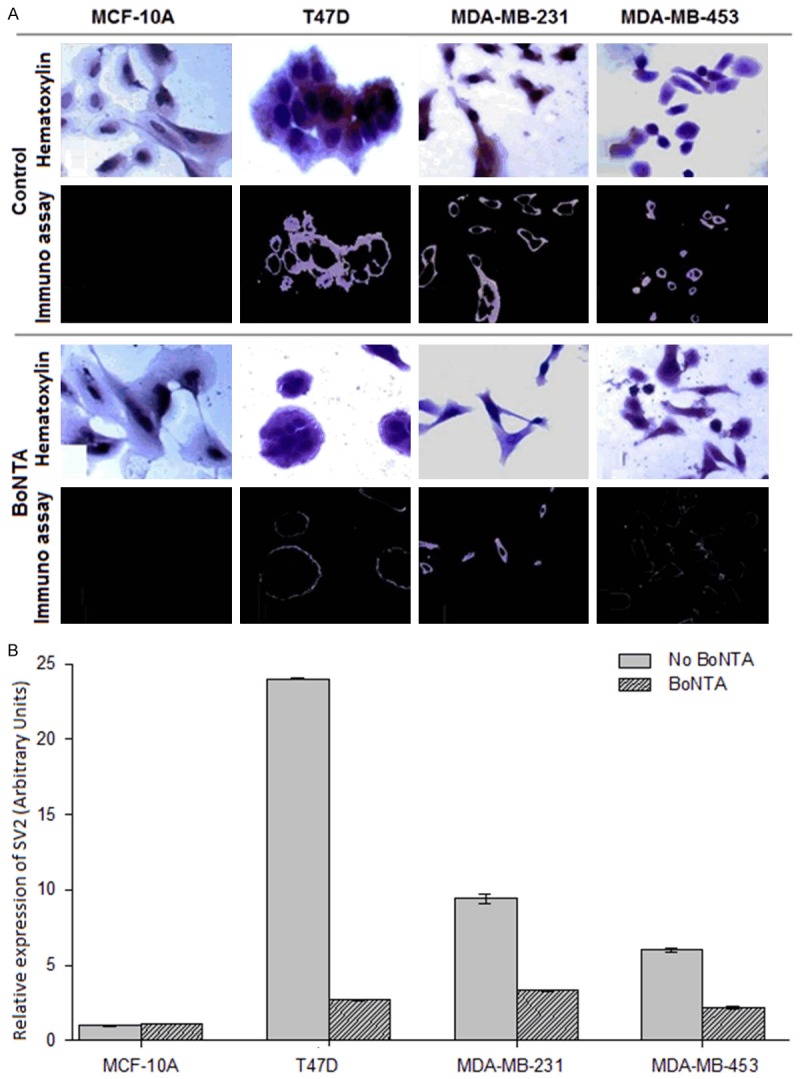
Figure 1.

Effect of BoNTA on SV2 protein expression in BCA cells. A. Microcopy observations. The same fields were assayed by both hematoxylin and immunocytochemistry stains for control cells (light field) and BoNTA-treated cells (dark field). B. Relative optical densitometry of the presence of SV2. Two-way analysis of variance with P = 0.001 for treatments and P = 0.004 for cell lines. All pairwise multiple comparison procedures were carried out with the Holm-Sidak method (overall significance level = 0.05).
