Figure 4.
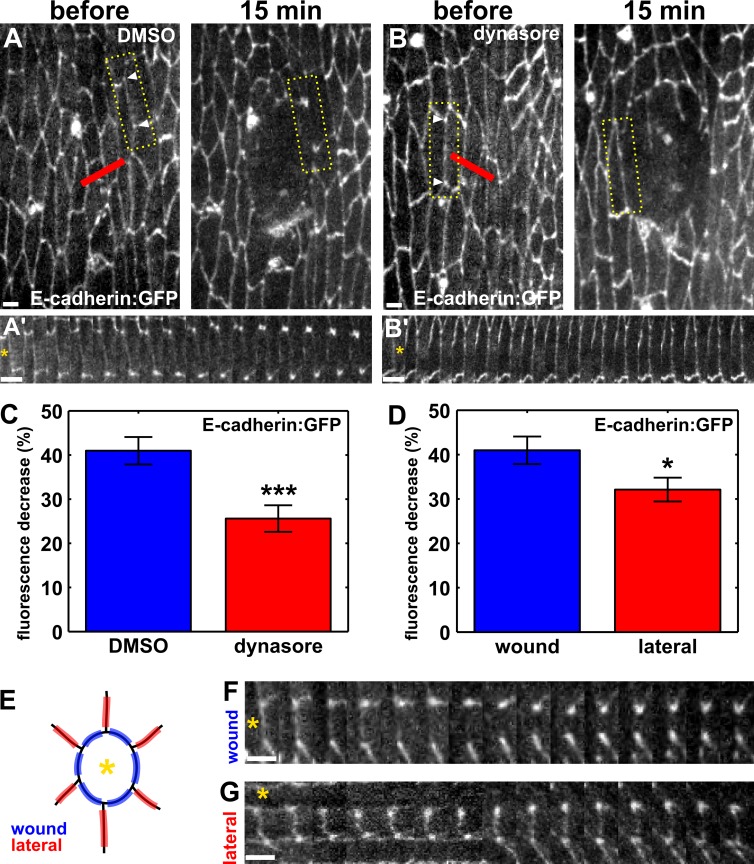
Dynamin-mediated endocytosis contributes to polarized E-cadherin removal from the wound margin. (A and B) Epidermal cells expressing E-cadherin:GFP in a DMSO-injected (A) or dynasore-injected (B) embryo. Time after wounding is shown. Red lines indicate wound sites. Arrowheads delimit boundaries used to quantify fluorescence. Yellow boxes outline the regions used to generate A′ and B′. Anterior left, dorsal up. Bars, 5 µm. (A′ and B′) Kymographs showing the redistribution of E-cadherin in the interfaces indicated in A and B. (C) Percentage of decrease in E-cadherin:GFP fluorescence at the wound margin 15 min after wounding in DMSO (n = 32 interfaces) and dynasore-injected (n = 39 interfaces) embryos. (D) Percentage of decrease in E-cadherin:GFP fluorescence 15 min after wounding in wound margin interfaces (n = 32) or lateral interfaces (n = 35). (E) Cartoon indicating the position of wound interfaces (blue, between the wound—indicated by the yellow asterisk—and an adjacent cell) and lateral interfaces (red, between two cells adjacent to the wound). (F and G) Kymographs showing E-cadherin:GFP redistribution in a wound (F) or a lateral interface (G). (A’, B’, F, and G) Asterisks denote the position of the wound. Bars, 1 min. Error bars, SEM; *, P < 0.05; ***, P < 0.001.

