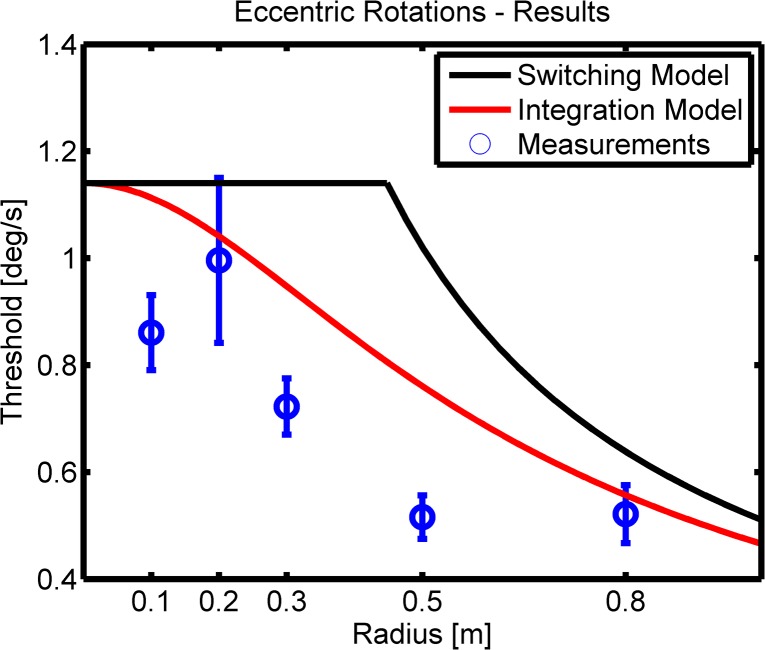
Fig 5. Model Results.
Mean results for the eccentric discrimination thresholds together with standard errors are shown (blue). Model fits are shown in black for the switching model and in red for the integration model. It can be clearly seen that the integration model predicts the eccentric thresholds better, but 3 out of 5 thresholds are even significantly lower than what the optimal integration model predicts.

