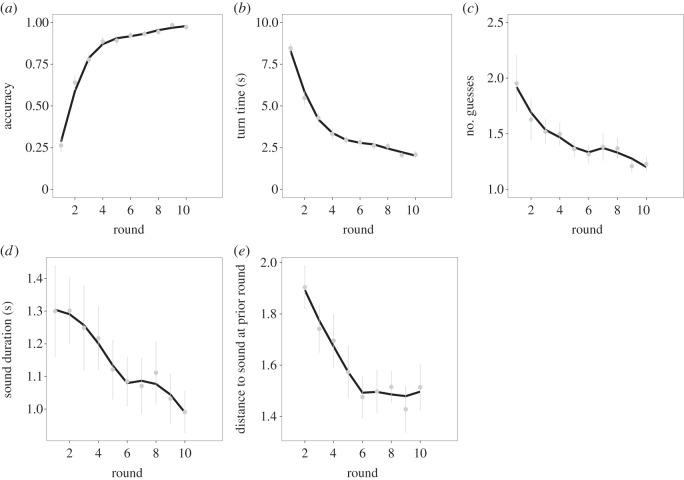
Figure 1.
Performance and change in the form of vocalizations over 10 round of vocal charades. The lines in each plot were fit by local regression. Error bars represent standard error between subjects. Round is displayed on the x-axis of each plot. (a) Mean accuracy increased across rounds. (b) The mean number of guesses per turn decreased across rounds. (c) Mean turn time (s) decreased across rounds. (d) Sound duration (s) decreased across rounds. (e) The mean Euclidean distance between the form of sounds produced at round t and round t−1. Sounds became increasingly similar across the first 5 rounds.

