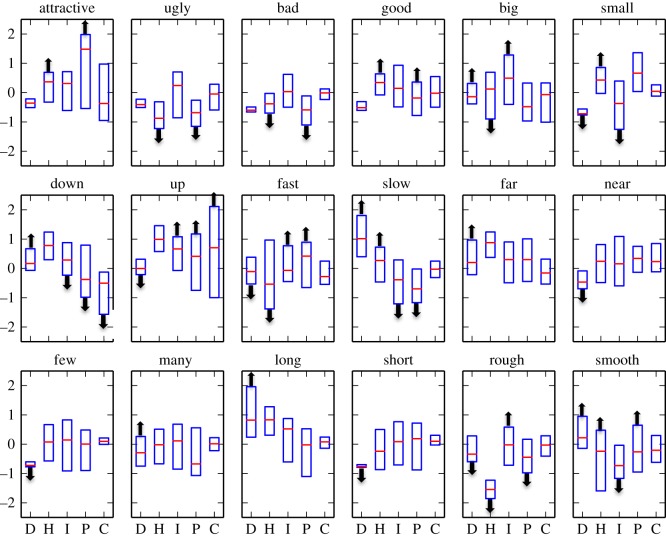
Figure 2.
The plots show the acoustic characteristics of each of the 18 meanings. The five variables are represented on the x-axis: D, duration; H, harmonics to noise ratio; I, intensity; P, pitch; C, pitch change. All values are normalized (z-scored) for each of the five measures. The red line shows the median and the blue box spans the first and third quartiles. The up and down arrows indicate variables that differed reliably between antonymic meanings. For example, vocalizations for bad differed from those for good by having a lower harmonics to noise ratio and pitch. The variables marked with arrows were the basis for the iconic template of each meaning.

