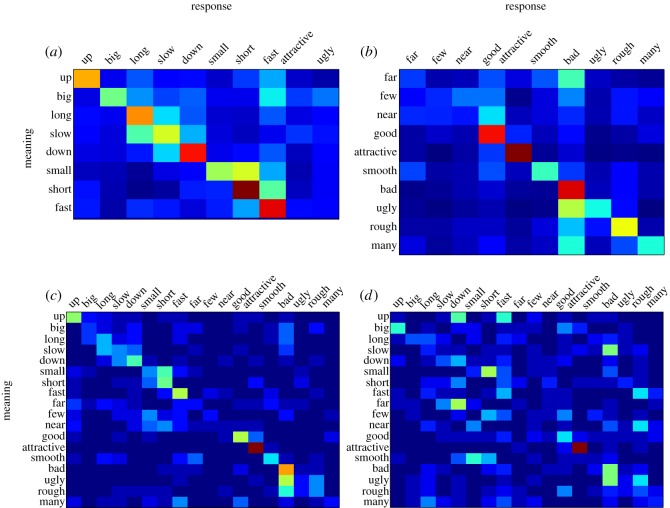
Figure 5.
Confusions made for each of the meanings during the playback experiments. The y-axis displays the meaning of the sound that was presented, and the x-axis displays the meaning that was selected. The ordering of meanings in each matrix was determined by a norming experiment that collected similarity ratings between each possible pair of meanings, with more similar words placed closer together. Warmer colours indicate more frequent choices. (a) Results from the first batch and (b) from the second batch in the playback experiment. Warmer colours gravitate along the diagonal, showing that listeners tended to select the correct response or a meaning that was similar to it. The results from the follow-up experiment with more and less iconic stimuli are shown in (c) and (d), respectively. Warmer colours gravitate along the diagonal for more iconic stimuli, but responses for less iconic stimuli appear more random.

