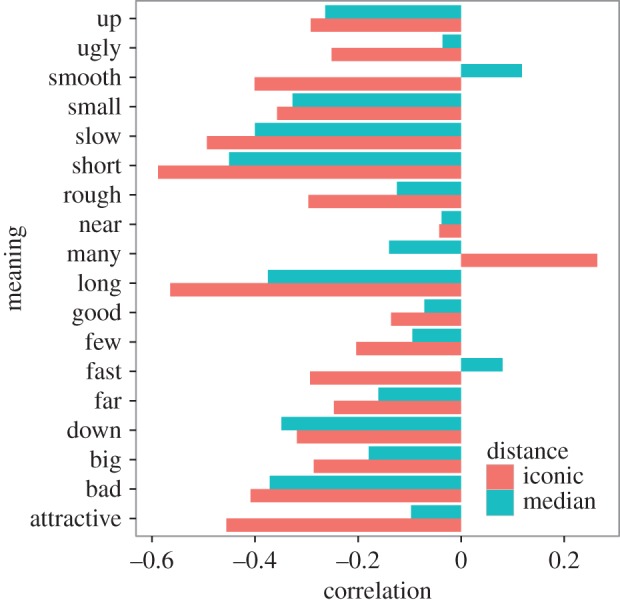
Figure 7.

Correlations between the two distance metrics to each particular meaning and probability of selecting that meaning. The correlation coefficient is plotted on the x-axis and meaning on the y-axis. Red represents iconic distance, and blue median distance. Negative correlations indicate that smaller distances to a particular meaning are associated with a higher likelihood of selecting that meaning. All meanings but many are associated with a negative correlation.
