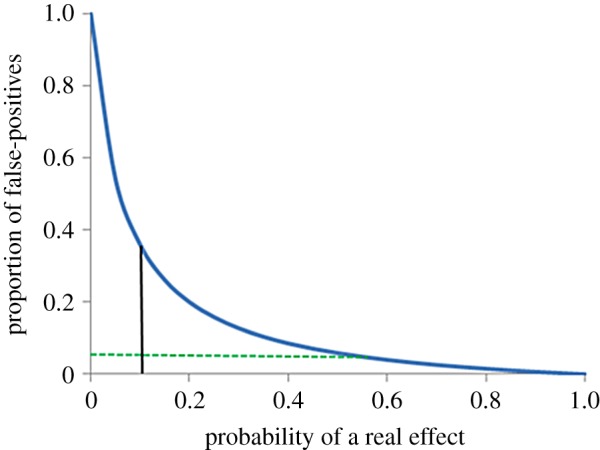
Figure 1.

Proportion of ‘false-positive’ rejections of the null hypothesis as a function of the probability that the hypothesized effect exists (i.e. is ‘real’). The curve is drawn for the case when α (the ‘significance level’ or the putative risk of a type I error) is 0.05 and the power of the test (i.e. the probability of correctly rejecting the null hypothesis when it is false) has the value 0.8 (mimicking the value adopted by Colquhoun 32).
