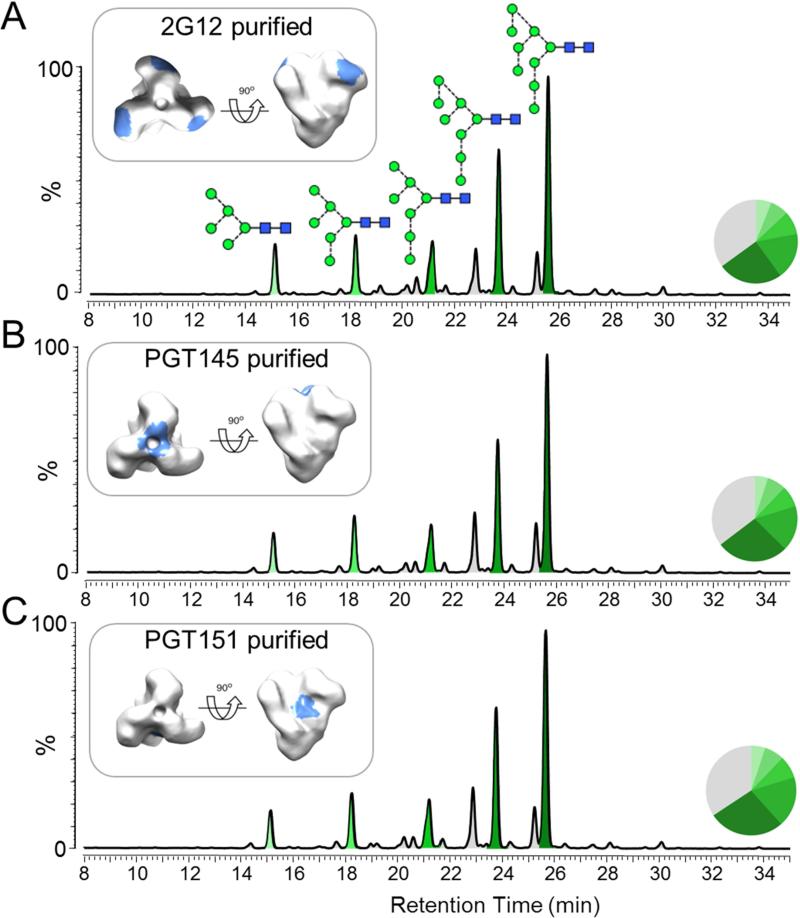
Figure 2. Glycan profiles of BG505 SOSIP.664 trimers following bNAb affinity purification.
CHO cell-derived trimers were purified by bNAb affinity chromatography using 2G12, PGT145 or PGT151, followed by SEC. Glycans isolated from reducing SDS-PAGE gels bands containing cleaved gp120 subunits were analyzed by HILIC-UPLC. The various bNAb epitopes are colored light blue on an EM reconstruction on the left. Peaks corresponding to oligomannose glycans are colored in shades of green and the corresponding peak areas are illustrated in the associated pie charts, as in Figure 1.See also Figure S3.

