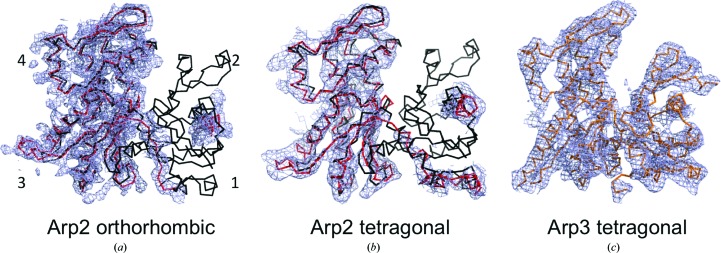
Figure 1.
2F o − F c electron-density maps (blue) contoured at 1σ of Arp2 and Arp3 from the new crystals. (a) Arp2 from the P212121 crystals at 3.9 Å resolution fitted with a backbone model of Arp2 (red) and compared with a backbone model of actin (black). Subdomains are labeled by the numbers 1–4. (b) Arp2 from the P41 crystals at 5.0 Å resolution fitted with a backbone model of Arp2 (red) and compared with a backbone model of actin (black). (c) Arp3 from the P41 crystals at 5.0 Å resolution fitted with an orange backbone model refined against the new data.

