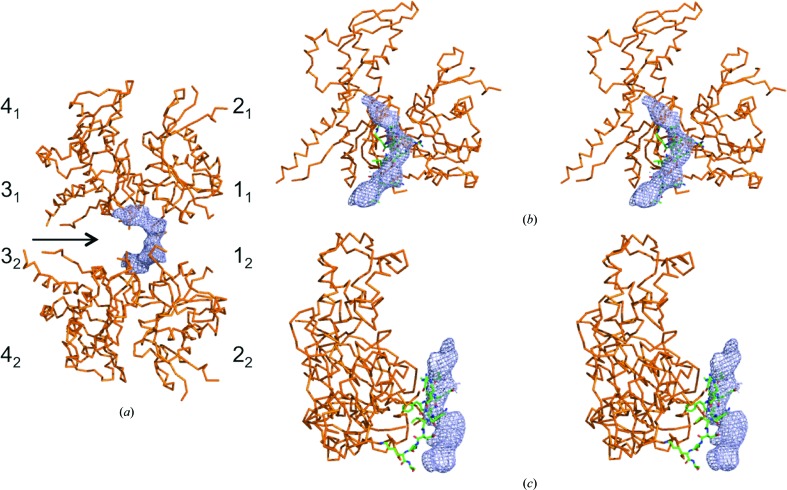
Figure 4.
Analysis of density near the barbed-end groove of Arp3 from crystals in the tetragonal space group. The density shown in blue is from a simulated-annealing composite OMIT map contoured at 1σ. Arp3 is shown as an orange backbone model. (a) View of two Arp3 molecules located on the noncrystallographic twofold rotational symmetry axis at the interface between the Arp2/3 complexes in the asymmetric unit. The four subdomains of Arp3 are numbered with subscripts 1 and 2 to indicate different Arp3 molecules. (b, c) Stereo pairs of models of Arp3 with a green backbone model of the ARPC1 insert helix from the structure of the Arp2/3 complex (PDB entry 3rse). The orientation of Arp3 in (b) is similar to that of the top Arp3 in (a) but is rotated about 20° around the x axis. The view in (c) is rotated 90° about the y axis relative to (b).

