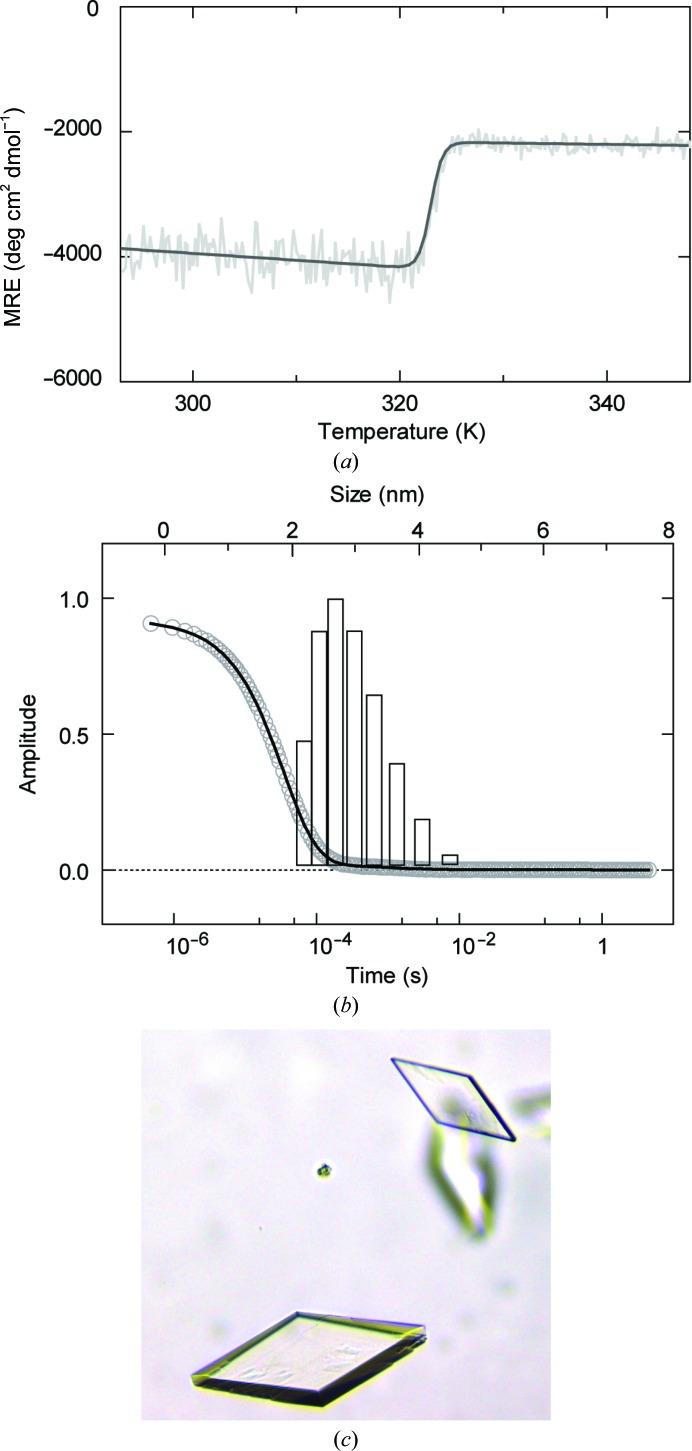
Figure 1.
Biophysical characterization and crystals of the SPRY_72–283 construct. (a) Thermal denaturation of SPRY_72–283 monitored by recording the CD signal at 222 nm. Data are given as the mean residue ellipticity (MRE) and were fitted to a two-state unfolding process, yielding an apparent T m of 323 K. Note that the CD signal is intrinsically low owing to the pure β-strand content of hDSPRY. (b) DLS measurements of SPRY_72–283. The lower x axis refers to the combined autocorrelation function (grey circles), with the corresponding fit shown as a black line. The upper x axis refers to the distribution of the hydrodynamic radii by relative mass (the amplitude of each bar indicates the share of the total mass of the sample) as obtained from the fit. The graph shows a peak at a hydrodynamic radius of 2.8 nm with a peak width of 18% relative standard deviation, which indicates a high degree of sample homogeneity. (c) Crystal of the SPRY_72–283 protein construct used to determine the structure of hDSPRY.

