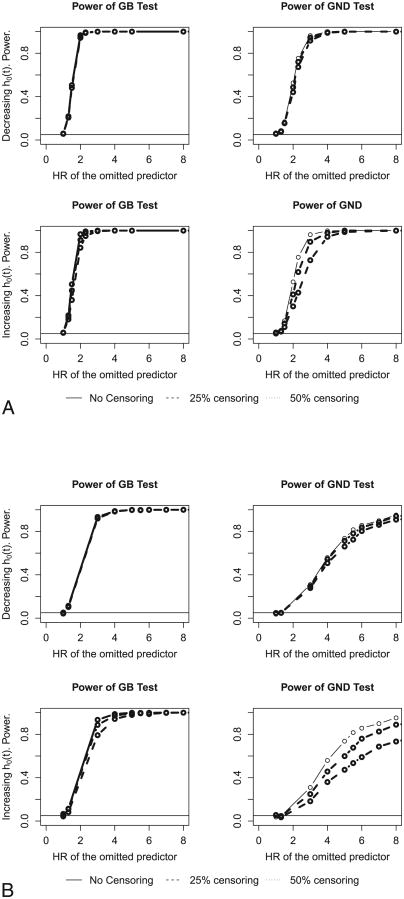
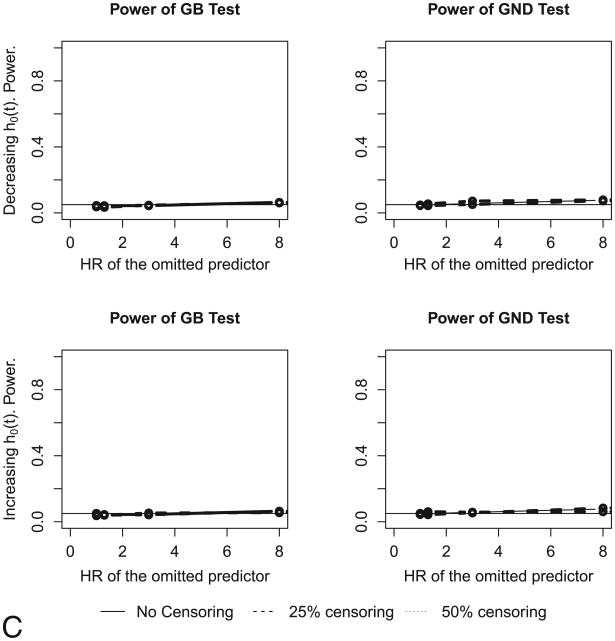
Figure 5.
A. Power of Grønnesby and Borgan (GB) and proposed Greenwood–Nam–D'Agostino (GND) tests when missing a quadratic term. N = 5000 and p = 0.1 for decreasing (top row) and increasing (bottom row) baseline hazards. (Models 7 and 7*). HR, hazard ratio. B. Power of Grønnesby and Borgan (GB) tests and proposed Greenwood–Nam–D'Agostino (GND) tests when missing an interaction term. N = 5000 and p = 0.1 for decreasing (top row) and increasing (bottom row) baseline hazards. (Models 8 and 8*). C. Power of Grønnesby and Borgan (GB) tests and proposed Greenwood–Nam–D'Agostino (GND) tests when missing an important predictor. N = 5000 and p = 0.1 for decreasing (top row) and increasing (bottom row) baseline hazards. (Models 9 and 9*). HR, hazard ratio. HR, hazard ratio.


