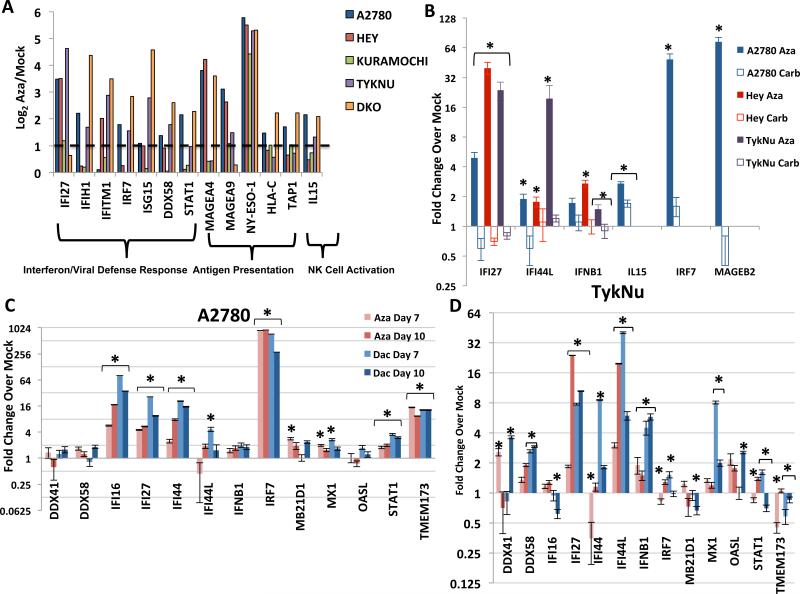
Figure 1. DNMT inhibitors upregulate immune genes in ovarian cancer cell lines.
A) Levels of immune genes in four EOC cell lines and DKO colon cancer cell line (DNMT1−/−, DNMT3B−/−) relative to its parental HCT116 line. Y-axis = log2 Aza/Mock fold change from microarray data. Dotted line denotes twofold change. B) qRT-PCR validation of immune genes in EOC cells treated for 72 hours: Mock, 500 nM Aza, or 500 nM− 3 μM carboplatin and rested for 7 days before assaying (Day 10). IC50s: A2780 (Aza = 848 nM, Carb = 457 nM), Hey (Aza = 4.1 μM, Carb = 12.2 μM), TykNu (Aza = 491 nM, Carb = 986.2 nM). C-D. qRT-PCR validation of interferon response genes in the A2780 (C) and TykNu (D) EOC lines treated with no drug (Mock), 500 nM Aza (Aza), or 100 nM Decitabine (Dac) for 3 days, and rested for 4 (Day 7) or 7 (Day 10) days before assaying. Y-axis = fold change over mock. Data in B-D are represented as mean +/− S.E.M of 3 biological replicates. * = p≤0.05. See also Figure S1.

