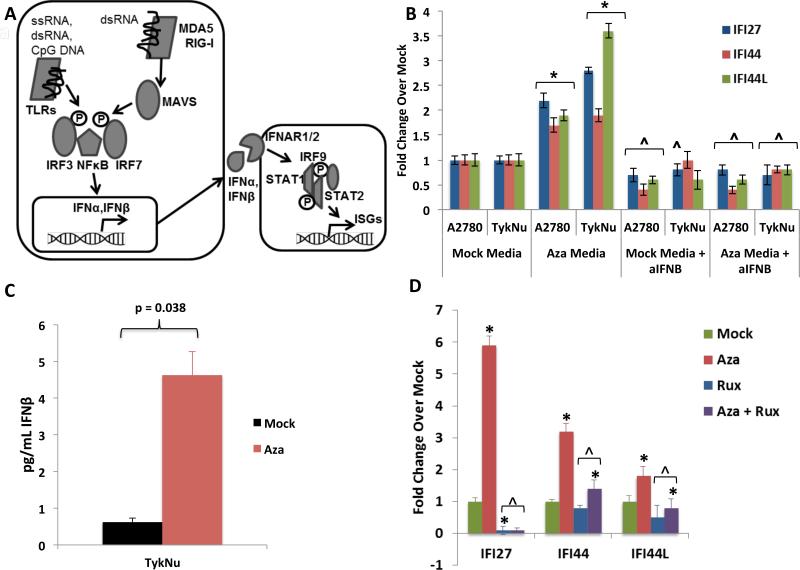
Figure 2. DNMTis upregulate immune signaling through secreted interferon.
A) Schematic of interferon pathway. Protein symbols outlined in text. B) Treatment of recipient A2780 or TykNu cells with media from cells treated with Mock or Aza, +/− addition of anti-IFNβ. Y-axis = qRT-PCR fold Aza/Mock of ISGs. * = p≤0.05 and ^ = p≤0.05, respectively, for Mock or Aza media with versus without anti-IFNβ versus Mock or Aza media plus anti-IFN β; C) ELISA of IFNβ in media from TykNu cells at Day 10 from studies in B. D) Treatment of EOC cells with Aza as in Figure 1c,d, but in the presence of 2 μM Ruxolitinib (Rux). qRT-PCR fold changes for ISGs. * = p≤0.05 for fold Aza over Mock and ^ = p≤0.05, Mock or Aza versus Mock + Rux or Aza + Rux. Data = mean +/− S.E.M. of three (B, D) or four (C) biological replicates. See also Figure S2.

