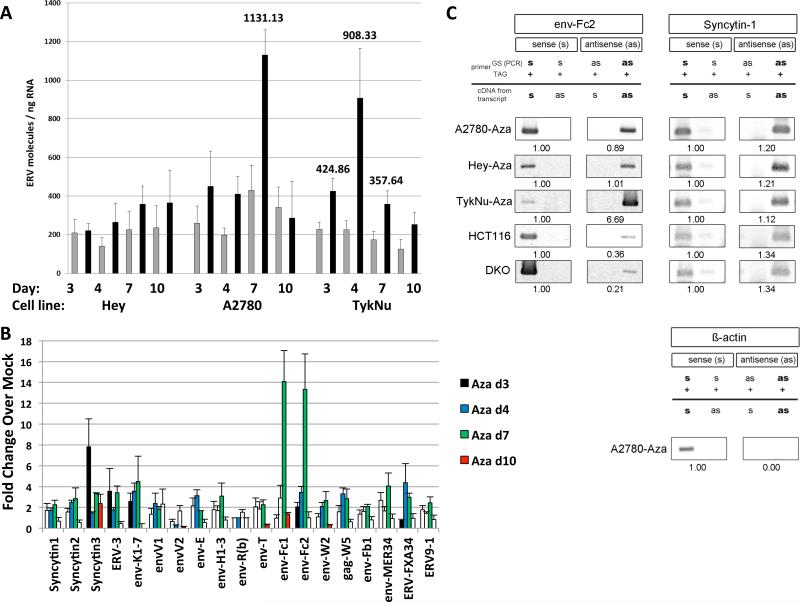
Figure 5. Aza upregulates sense and antisense ERV transcripts.
RNA was isolated from cells at last (Day 3), one (Day 4), three (Day 7) and seven (Day 10) days after Mock or 500 nM Aza (Aza) for 3 days. A) Total number of molecules for all ERV genes; error bars = S.E.M for 4 independent experiments. Numbers above bars = significant data for indicated days. Gray = Mock, Black = Aza. B) qRT-PCR of ERV genes in A2780 cells for 4 independent experiments. Y-axis= fold increases for Aza/Mock +/− S.E.M and normalized to Mock = 1. White bars = non-significant and colored bars = significant ERV gene induction (p<0.05). C) TASA-TD PCR amplified sense and antisense transcripts of the env-Fc2 (731 bp) and Syncytin-1 (202 bp) genes from first strand cDNA. Aza treated A2780, Hey, and TykNu, and HCT116 and DKO cells are indicated. Ratios of sense (s) and antisense (as) determined by ImageJ. PCR primers = gene specific (GS); TAG. β-actin sense 399 bp amplification product = negative control for as transcripts (Chen et al., 2004). See also Figure S5.

