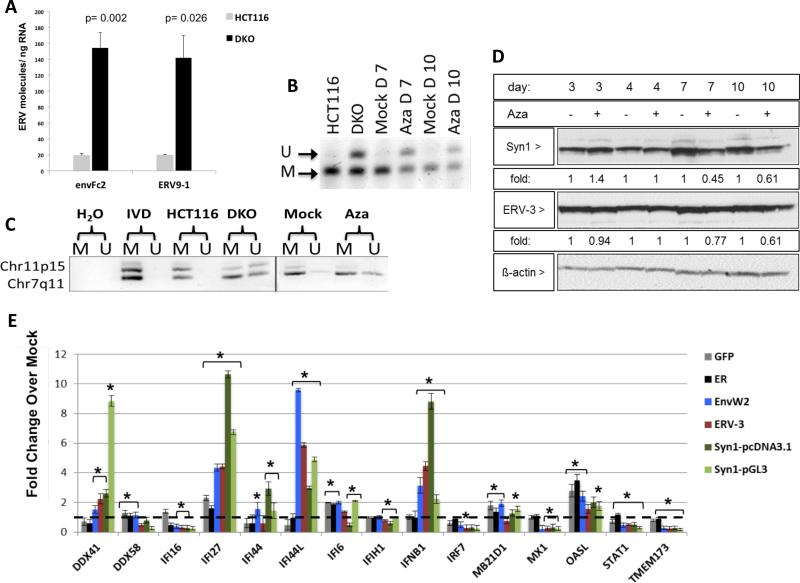
Figure 6. Aza upregulates ERV transcripts, but not proteins, through DNA demethylation.
A) env-Fc2 and erv-9-1 ERV gene total number of molecules, assayed by qRT-PCR, for DKO (DNMT1−/−, DNMT3B−/−) and parental HCT116 cells. Y-axis = mean +/− SEM for n = 6 biological replicates. * = p≤0.05 for DKO versus HCT116. B) DNA methylation changes in ERVs in A2780 cells treated with Mock or 500 nM Aza for 3 days at post-treatment day 4 (Day 7), or 7 (Day 10). Bisulfite treated DNA was amplified and digested with the AciI enzyme producing 155 and 44 bp fragments of methylated DNA while unmethylated DNA does not digest (189 bp fragment). “U” = unmethylated band, “M” = methylated band. C) DNA from B) was subjected to Methylation-specific PCR for Fc2 family members on chromosomes 7 and 11. U” = unmethylated, “M” = methylated. IVD = in vitro methylated DNA. D) Syncytin-1 and ERV-3 protein levels in EOC cells treated as in B). Fold change for densitometry by ImageJ for Aza vs Mock cells normalized to β-actin protein levels E) Transfection of full-length env genes from EnvW2, ERV-3, or Syncytin-1 or EGFP and ER controls in TykNu cells. qRT-PCR was performed for ISGs 7 days after transfection. Dotted black line indicates 1. Y-axis = mean +/− S.E.M fold change of three biological replicates for overexpression/ Mock. * = p≤0.05. See also Figure S6.

