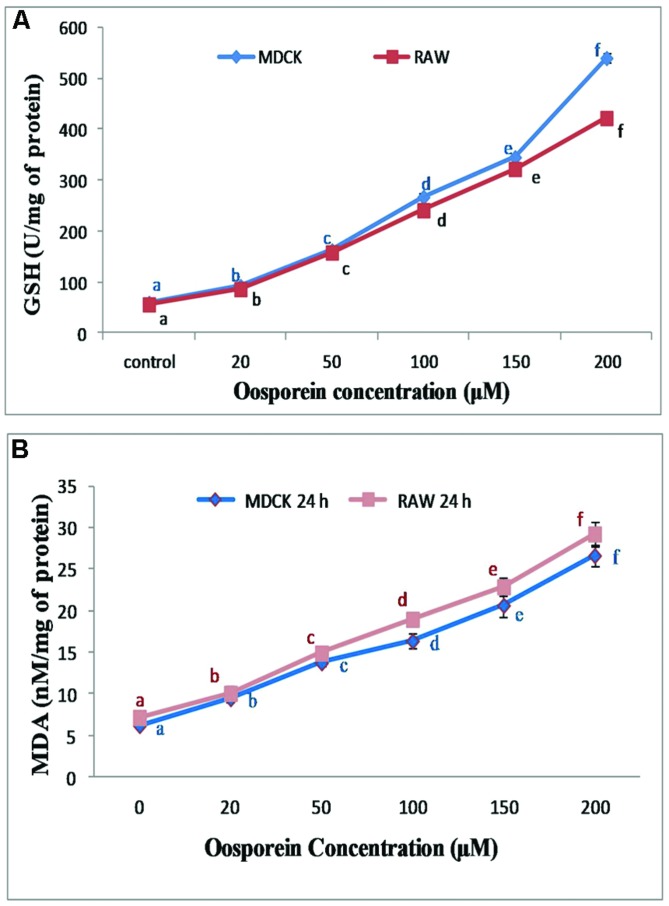
FIGURE 3.
(A) Dose dependent effect of oosporein on Glutathione hydroxylase (GSH) in MDCK and RAW 264.7 celllines; (B) Estimation of lipid peroxidation products by TBARS assay. Values represent mean ± SD of six parallel experiments. In the figure each a mean values followed by the different letter are significantly different according to DMRT at p < 0.05.

