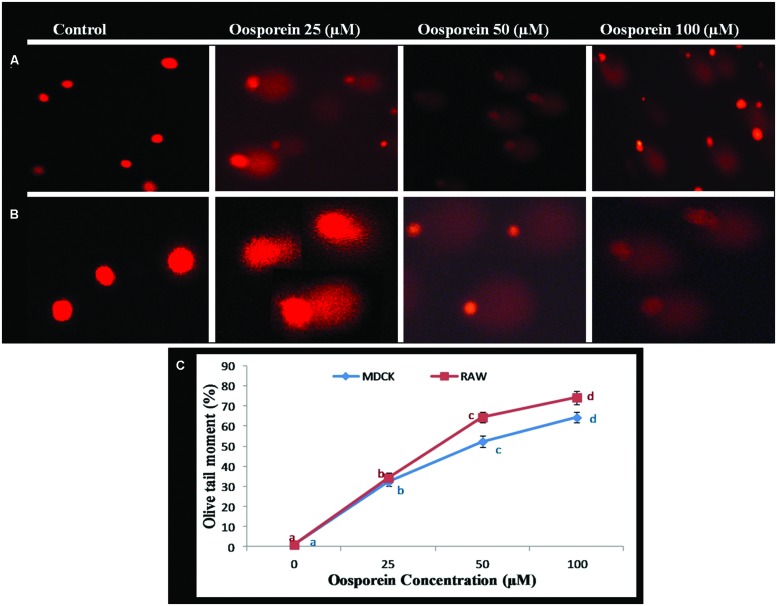
FIGURE 4.
(A) Estimation of DNA damage induced by oosporein in MDCK celllines. (B) Estimation of DNA damage induced by oosporein in RAW 264.7 celllines. (C) Effect of different concentrations of oosporein on nuclear organization of MDCK and RAW 264.7 cells. Values represent mean ± SD of six parallel experiments. In the figure each series mean values followed by the different letter are significantly different according to DMRT at p < 0.05.

