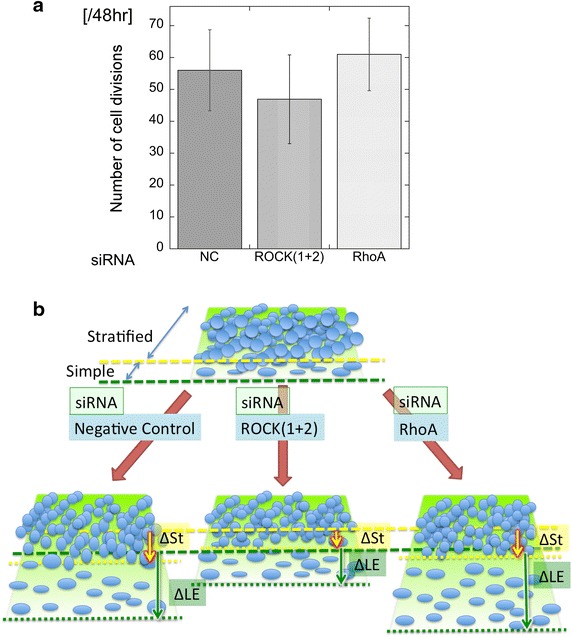
Fig. 6.

a Total numbers of mitotic cells, as determined by time-lapse video analysis. Data shown represent the mean ± SEM of at least three different visual fields. No significant differences were observed (ANOVA). b Schemes presenting the differences between ΔLE and ΔSt for each siRNA knockdown condition. The velocity of the leading wounded edge (ΔLE) of cells with siRNA-mediated knockdown of RhoA was faster than those of control cells and of cells with siRNA-mediated knockdown of ROCKs. The velocity of the stratified region (ΔSt) of ROCKs-knockdown cells was the slowest among all samples
