Figure 2.

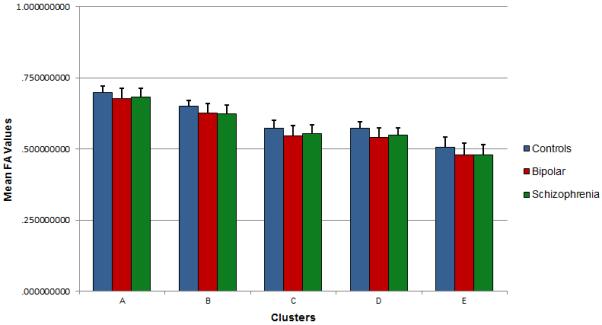
Mean FA values for the 5 clusters obtained from the TBSS analysis for each of the 3 groups – healthy controls (HC), schizophrenia (SCZ) and bipolar disorder (BPP). Error bars represent standard deviation (SD) values.

Mean FA values for the 5 clusters obtained from the TBSS analysis for each of the 3 groups – healthy controls (HC), schizophrenia (SCZ) and bipolar disorder (BPP). Error bars represent standard deviation (SD) values.