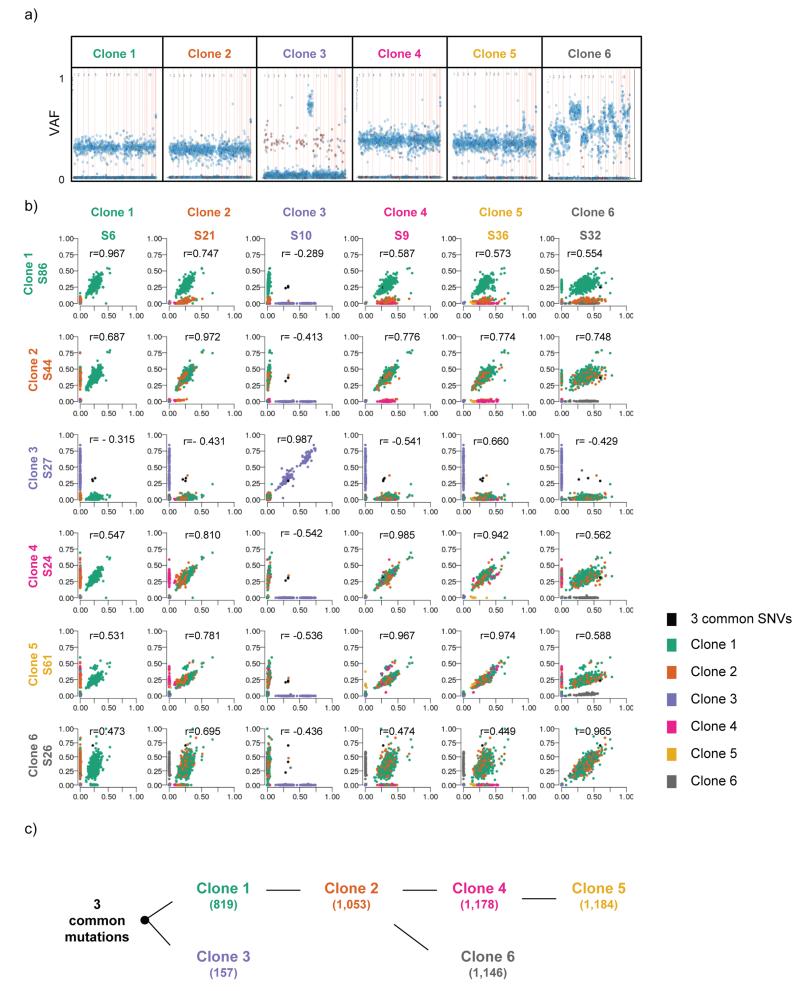
Figure 5. Six distinct clones are present within patient AHM1051’s non-dysplastic Barrett’s esophagus.
a) Variant allele fraction (VAF) plot representing an example sample of the six distinct clones. The 1,437 assessed SNVs are represented by dots within the chart. The SNVs are ordered on the x-axis according to their genomic location (from chr1 to sex chromosomes). The y-axis represents the VAF for each mutation for that sample. The blue dots represent intergenic or intronic SNVs and the red dots represent coding SNVs. b) Scatter plots showing the correlation between two different representative samples within the same clone as well as compared to two different samples from every other clone. The sample names (e.g. S6 (sample 6)) are given under the different clone headings. Each dot within the scatter plot represents one of the 1,437 assessed SNVs and the dots are coloured according to the different clones the SNVs belong to. The r value represents the Pearson correlation. c) Diagram representing the clonal ordering within patient AHM1051’s Barrett’s esophagus segment. The numbers in brackets represent the number of SNVs (out of a total of 1,437 that were assessed) that are present in each of the clones.

