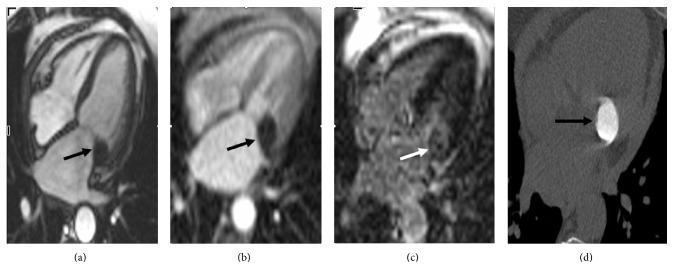
Figure 2.
Balanced steady state free precession (SSFP) sequence image (a) shows hypointense lesion with well-defined borders (black arrow). First pass image (b) demonstrates no contrast enhancement. Delayed phase postcontrast phase sensitive inversion recovery (PSIR) image (c) shows peripheral enhancement. Multidetector cardiac CT image for calcium scoring (d) shows diffuse calcific lesion with well-defined borders located in mitral annulus (black arrow).

