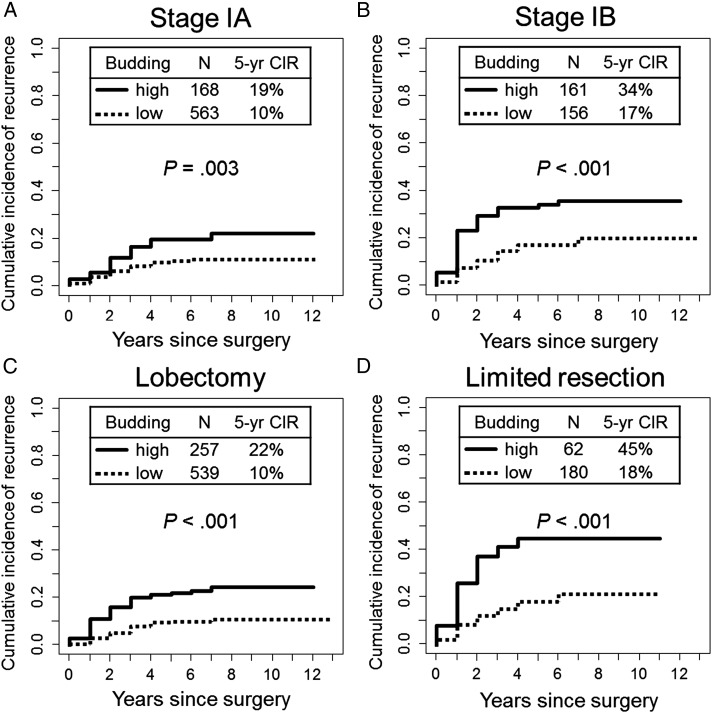
Figure 4 –
A-D, Subgroup analysis of CIR analysis of tumor budding by stage and surgical procedure. A, In patients with stage IA disease, 5-y CIR for patients with high-grade tumor budding was significantly higher (19%) than it was for patients with low-grade budding (10%; P = .003). B, In patients with stage IB disease, 5-y CIR for patients with high-grade tumor budding was significantly higher (34%) than it was for patients with low-grade budding (17%; P < .001). C, In patients undergoing lobectomy, 5-y CIR for patients with high-grade tumor budding was significantly higher (22%) than it was for patients with low-grade budding (10%; P < .001). (D) In patients undergoing limited resection, 5-y CIR for patients with high-grade tumor budding was significantly higher (45%) than it was for patients with low-grade budding (18%; P < .001). See Figure 3 legend for expansion of abbreviation.

