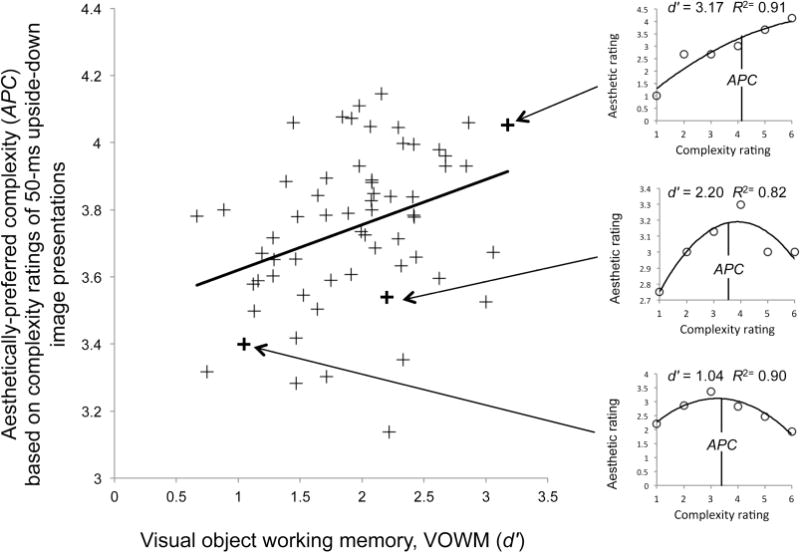
Figure 3.

Scatterplot showing the correlation between aesthetically-preferred complexity, APC, and visual-object working memory, VOWM (measured in d′). APC was computed for each participant as the center-of-mass of the quadratic fit to the aesthetic-rating-vs.-complexity-rating function (see text for details). On the right side examples of aesthetic-rating-vs.-complexity-rating functions for participants with high (top), medium (middle), and low (bottom) VOWM are shown along with the corresponding quadratic fits and APCs (R2 indicating the goodness of fit).
