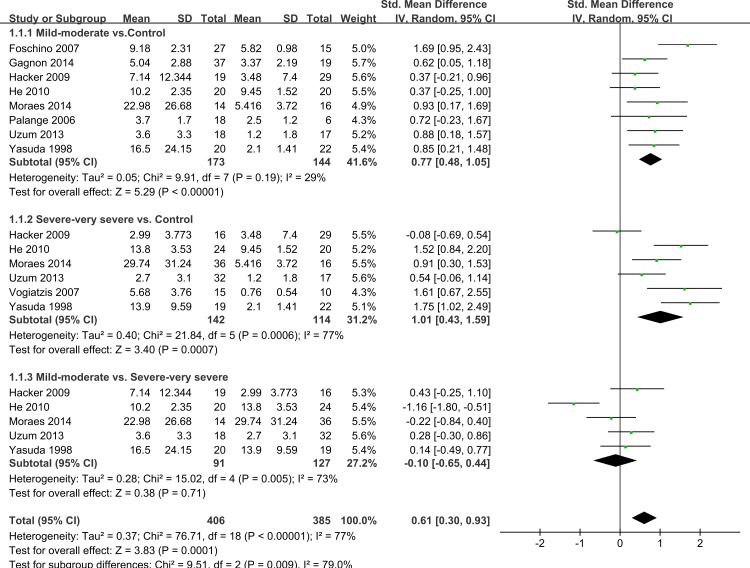
Figure 4. Forest plot for subgroup analysis by disease severity.
Forrest plot of subgroup studies in the meta-analysis that investigated the association between serum IL-6 concentrations and pulmonary functions of COPD, using a random-effects model. COPD, chronic obstructive pulmonary disease; SD, standard difference; SMD, standard mean difference; CI, confidence interval.

