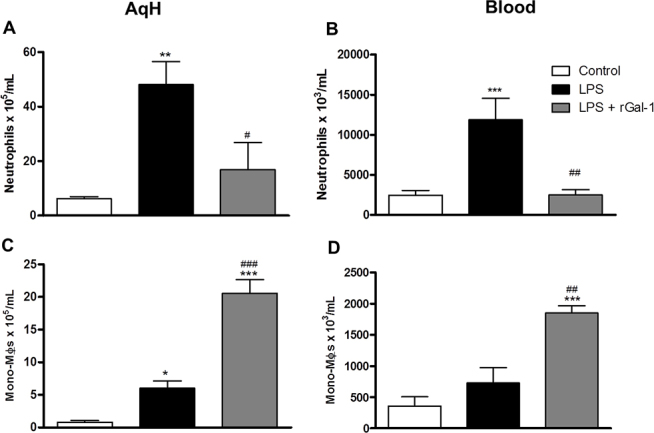
Figure 2.

Quantitative analysis of neutrophils and mononuclear phagocytic cells in aqueous humor and blood. A, C: Aqueous humor [AqH]. B, D: Blood. Mononuclear phagocytic cells [Mono-Møs]. Data represents the mean ± SEM of the number of cells x 105 per ml (AqH) and x 103 per ml (blood; n = 5); *p<0.05, **p<0.01, ***p<0.001 versus control; #p<0.05, ##p<0.01, ###p<0.001 versus LPS.
