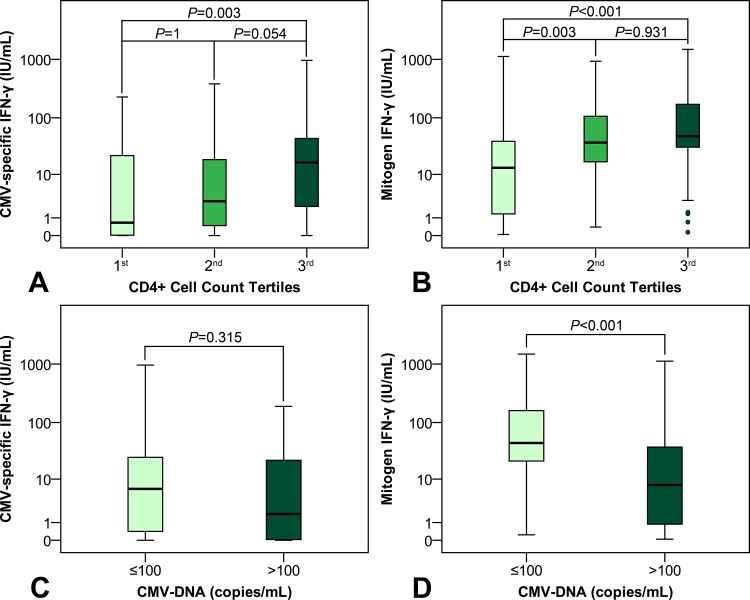
Fig 2. Tukey’s schematic boxplot showing the association between CMV-specific and mitogen IFN-gamma response and both CD4+ (A, B) and CD8+ (C, D) T cell count.
CD4+ T cell count tertiles: 1st: < 115, 2nd: 115–217, and 3rd: > 217 cells/μL. CD8+ T cell count tertiles: 1st: < 478, 2nd: 478–903, and 3rd: > 903 cells/μL.

