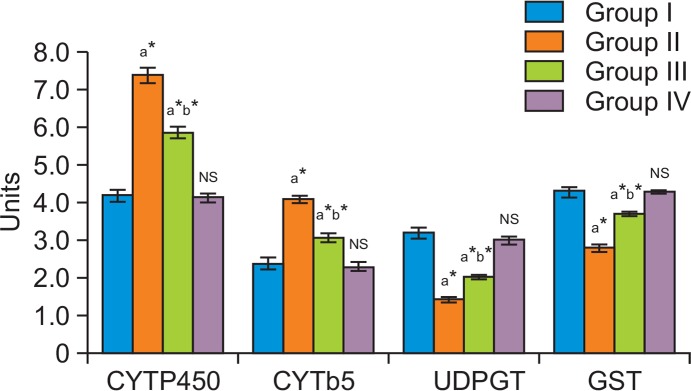
Fig. 3.

Effect of myrtenal on Phase I & Phase II enzyme levels in liver of control and experimental animals. The levels of xenobiotic metabolizing enzymes in the liver of control and experimental animals are presented in the bar diagram. Liver metabolizing enzyme levels were found normal in group I control animals. Group II DMH induced animals express increased levels of phase I enzymes and decreased phase II enzymes. Myrtenal treated group III animals exhibit reversion of altered levels of phase I and phase II biotrans-formation enzymes to near normal compared to group II DMH induced animals. No significant changes were observed in group IV myrtenal alone treated animals. Results are expressed as mean ± S.D for six animals. aGroup II, III & IV compared with Group I. bGroup III compared with Group II.*p<0.05, NSNot Significant. Units: Cytochrome P450-n moles/mg microsomal protein/min; Cytoch rome b5-n moles/mg microsomal protein/min; GST- n moles/mg microsomal protein/min; UDP-GT- n moles/mg microsomal protein/min.
