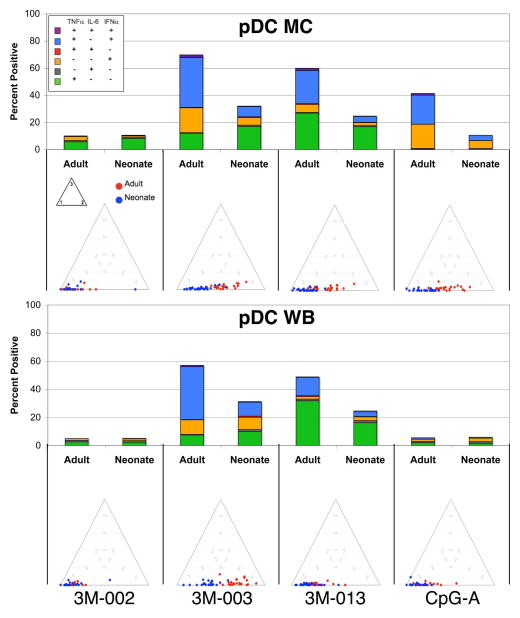
Figure 4. Neonatal pDCs are less responsive and less polyfunctional to TLR7/8 and TLR7 stimulation for both MC & WB.
MC or WB samples from 25 adults and 25 neonates were stimulated with the indicated TLR ligands (only results for the maximal concentration for each ligand are shown) for 6 hours, and expression of intracellular TNF-α, IL-6, and IFN-α by pDCs was determined by multiparameter flow cytometry. A) Results (mean ± SD) are the percentage and the mean fluorescence intensity (MFI) of pDCs producing an individual cytokine or the total percentage of cells producing any cytokine, with the top and bottom panels showing pDC in MC and WB, respectively. B) Top - stacked bar graphs in which the overall height of the bar indicates the total percentage of pDCs producing any cytokine and the height for each color (coded as shown in the insert) indicates the percentage of pDC expressing an individual cytokine or cytokine combination. Bottom - ternary plots, in which each circle depicts the degree of polyfunctionality of cells from one adult (red circles) or neonate (blue circles). See Figure 2 legend for further details.

