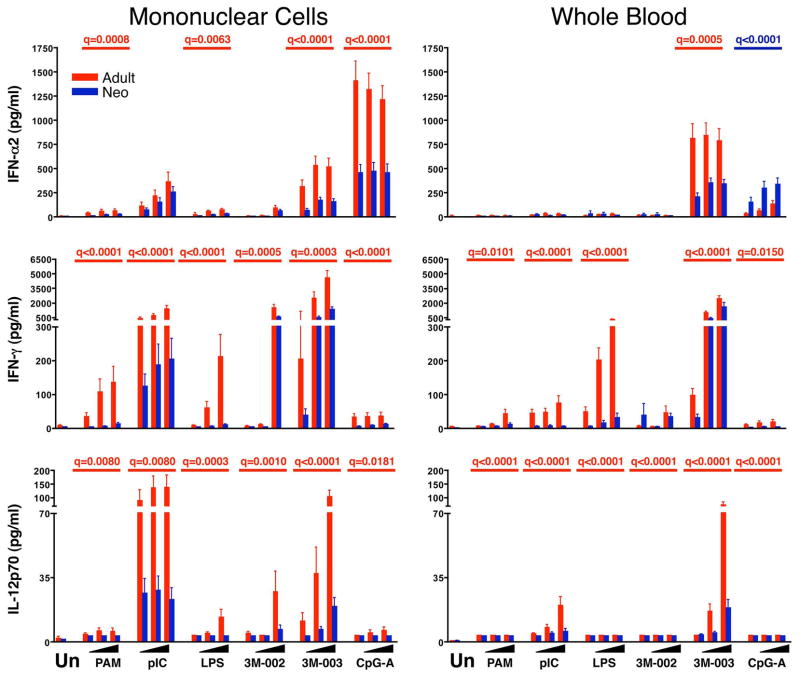
Figure 6. Diminished production of type 1 cytokines by neonatal cells.
Results are the mean ± SE concentrations of IFN-α2 (top), IFN-γ (middle), and IL-12p70 (bottom) in 18 hr culture supernatant for MC (left panels) or WB (right panels), comparing adult (red bars and q values) to neonatal (blue bars and q values) samples (n = 25 each). Cultures were stimulated with nothing (unstimulated, Un) or with increasing concentrations from left to right (indicated by the black triangles) of PAM3CSK4 (TLR2/6), pI:C (TLR3), LPS (TLR4), 3M-002 (TLR8), 3M-003 (TLR7/8), or CpGA (TLR9). The probability that differences are significant after correction for multiple comparisons is shown as q-values (see statistical methods for description) but only if there was a significant difference between neonatal and adult samples.

