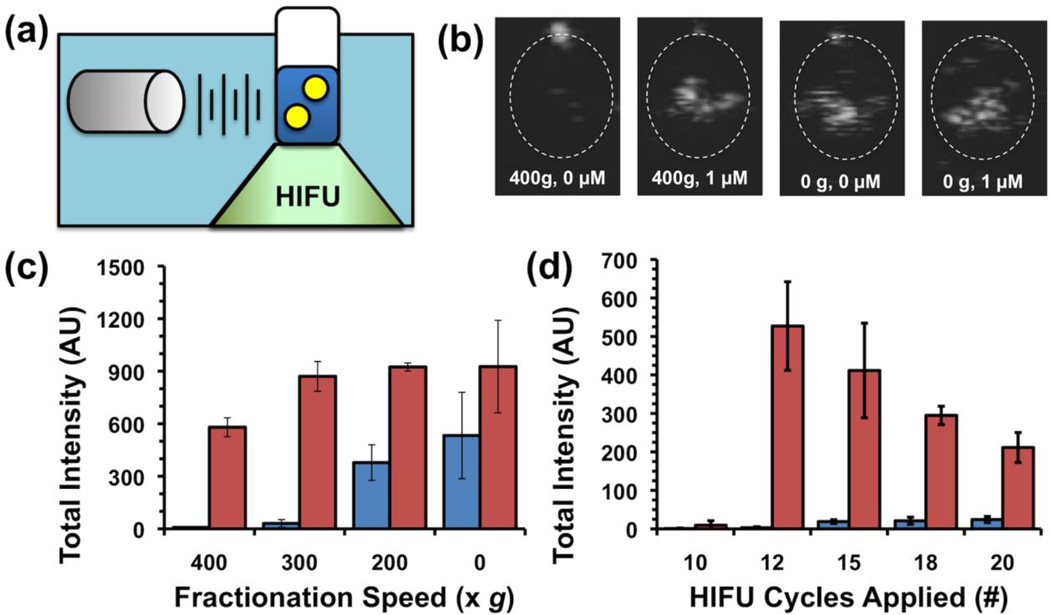
Figure 2.
(a) Schematic of setup for measuring ultrasound signal from HIFU-vaporized droplets. (b) Representative still images taken from movies acquired during HIFU pulsing of droplet samples. From left to right: 400g-fractionated droplets with no streptavidin, 400g-fractionated droplets with 1 µM streptavidin, as-made droplets with no streptavidin, and as-made droplets with 1 µM streptavidin. (c,d) Integrated brightness from HIFU pulsing of droplet samples. Blue bars (left) indicate without streptavidin, red bars (right) indicate 1 µM streptavidin. Error bars = 1 SD; studies were run in at least triplicate. (c) Integrated brightness as function of fractionation conditions. (d) Integrated brightness as function of number of sine waves per pulse packet.

