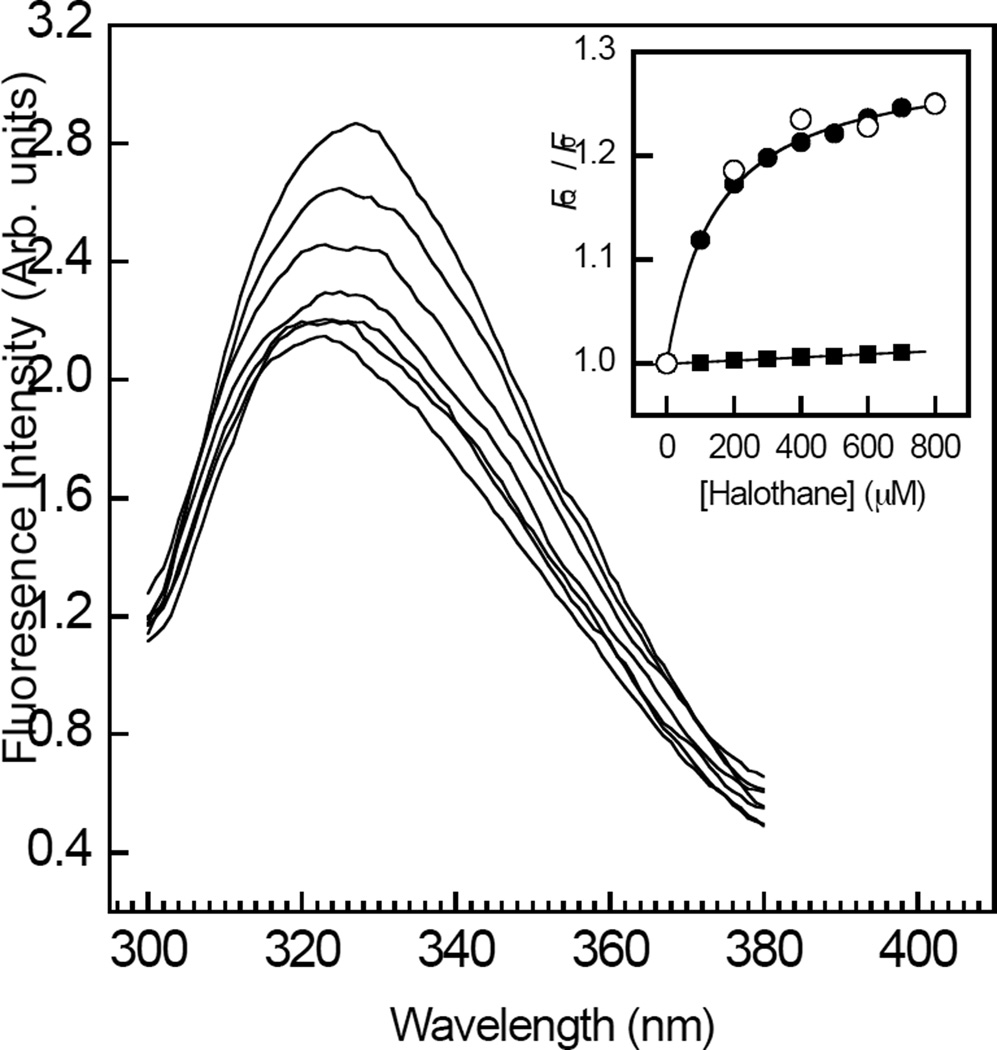
Figure 1.
Concentration dependent effects of halothane on the steady-state tryptophan emission fluorescence of RhoGDIα. Tryptophan emission fluorescence spectra of RhoGDIα (500 nM) were acquired upon excitation at 295 nm in the presence of increasing levels of halothane (0–800 µM). Inset, the fluorescence intensities at maximal wavelengths obtained using an excitation wavelength of 295 nm (●) or 305 nm (○) were plotted as a function of halothane concentration. The solid curve corresponds to a least squares non-linear regression fit of the data obtained using an excitation wavelength of 295 nm to Eq. 1. Also shown is the concentration dependent effect of halothane on the fluorescence intensities at maximal wavelength obtained for free L-tryptophan upon excitation at 295 nm (▪). The solid line through the data was obtained using linear regression. The data are representative of triplicate experiments. The fits of each individual replicate experiment yielded similar parameter values and errors. Other details are given under “Experimental Procedures.”

