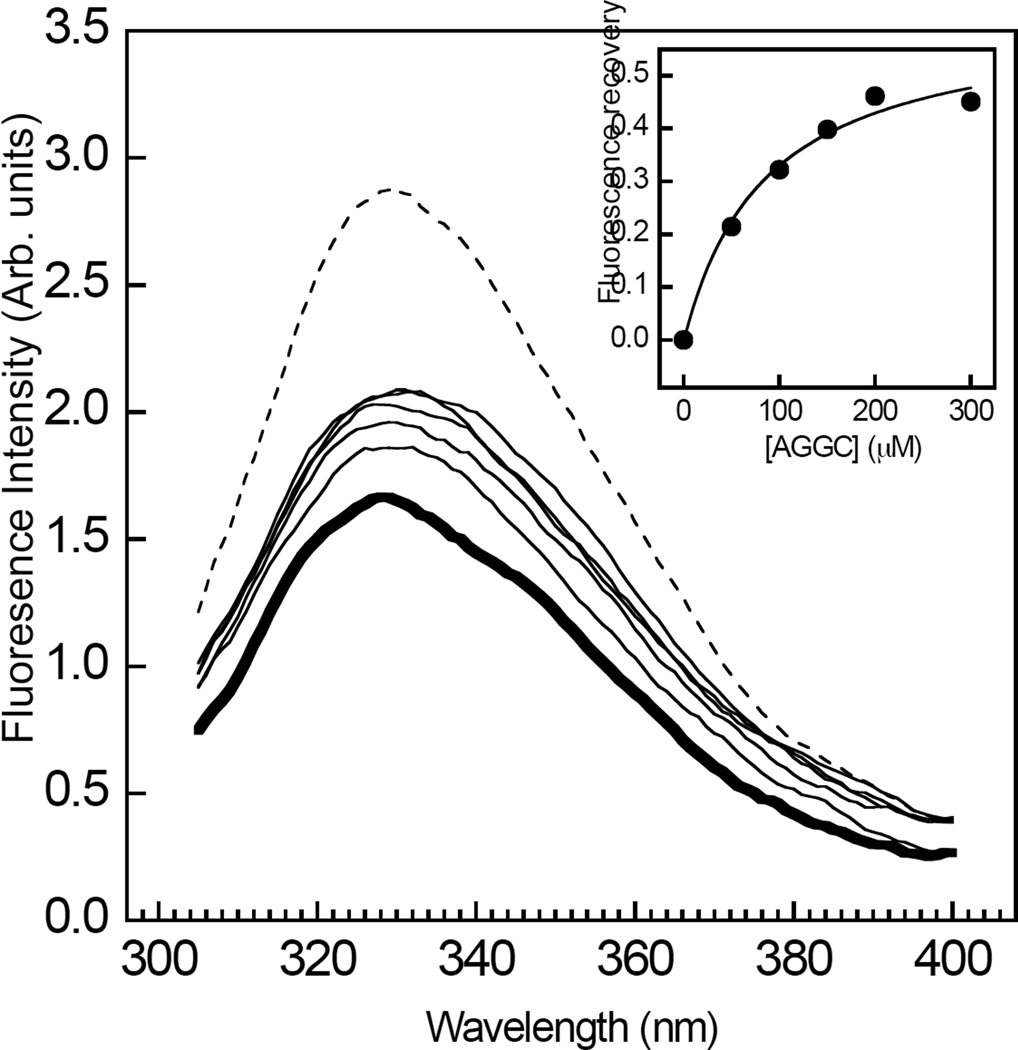
Figure 2.
Concentration dependent effects of AGGC on the halothane induced quenching of RhoGDIα tryptophan emission fluorescence. The steady-state tryptophan emission fluorescence spectra of RhoGDIα (500 nM) were obtained with (bold) or without (dashed) 1 mM halothane, in the presence of increasing concentrations of AGGC (0–300 µM). Inset, the recovery in emission fluorescence from quenching by 1 mM halothane in the presence of AGGC was plotted as a function of AGGC concentration. The solid curve corresponds to a fit of the data obtained to Eq. 2 using least squares non-linear regression analysis. Data are representative of at least three independent experiments. The fits of each individual replicate experiment yielded similar parameter values and errors. Other details are described in “Experimental Procedures.”

