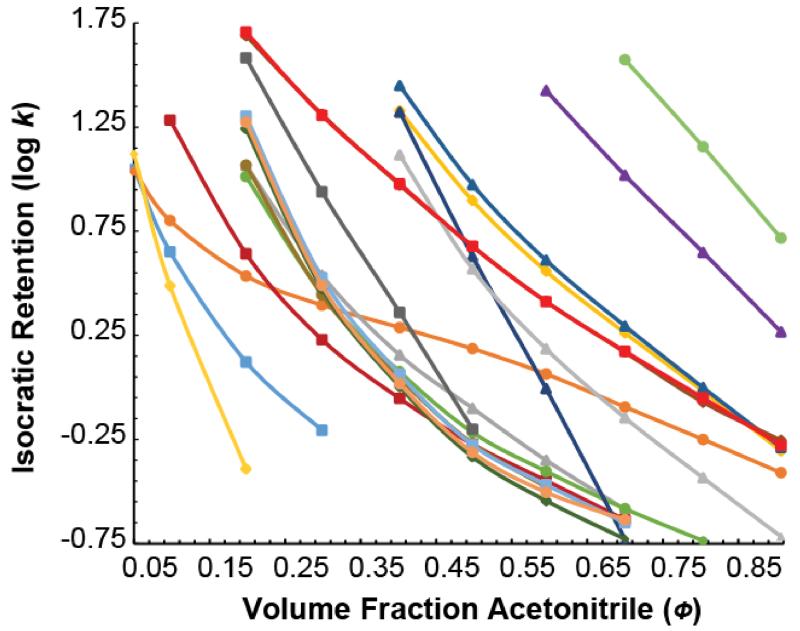
Figure 3.
Isocratic log k vs. solvent composition for the 19 test compounds. These include N,N-diethylacetamide ( ), N-allyl aniline (
 ), 1,3-naphthalenediol (
 ), diphenylamine (
 ), 7-amino-4-methylcoumarin (
 ), naphthalene acetamide (
 ), 2-phenylindole (
 ), anilinoacetaldehyde diethyl acetal (
 ), tetrabutylammonium (
 ), abscisic acid (
 ), tetrapentylammonium (
 ), prednisone (
 ), cortisone (
 ), hydrocortisone (
 ), curcumin (
 ), chlorogenic acid (
 ), p-coumaric acid (
 ), dodecanophenone (
 ), and di-n-pentyl phthalate (
 ). Though the relationships are difficult to distinguish, one can see that they cover a wide range in retention and that the relationships do not generally run parallel to one another as is assumed in linear retention indexing.

