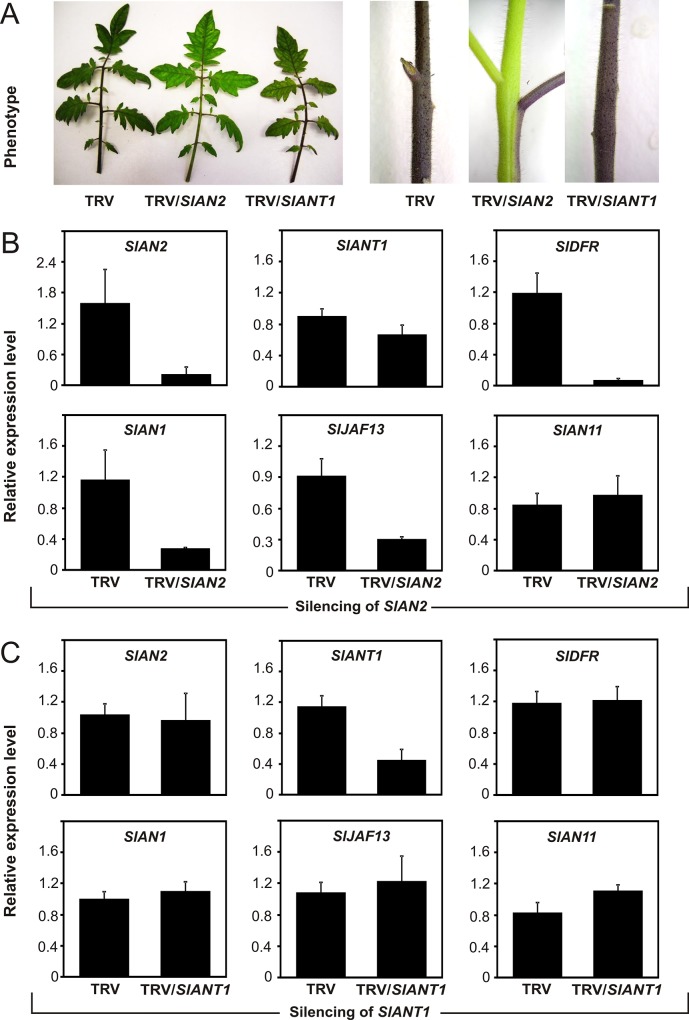
Fig 5. Virus Induced Gene Silencing of SlAN2 and SlANT1 in vegetative tissues of tomato plants.
Phenotype of SlAN2 and SlANT1 silenced leaves and stems (TRV/SlAN2, TRV/SlANT1, respectively) compared to non-silenced controls (TRV) (A). Quantitative analysis of transcript levels for SlAN2, SlAN1, SlAN11, SlDFR, SlANT1 and SlJAF13 in SlAN2 silenced tomato plants (TRV/SlAN2) (B) and in SlANT1 silenced tomato plants (TRV/SlANT1) (C) compared to non-silenced controls (TRV). Expression levels are shown as relative units, with the value of one of the biological replicates of control TRV samples set to one. Data are means of three biological replicates ± SD.

