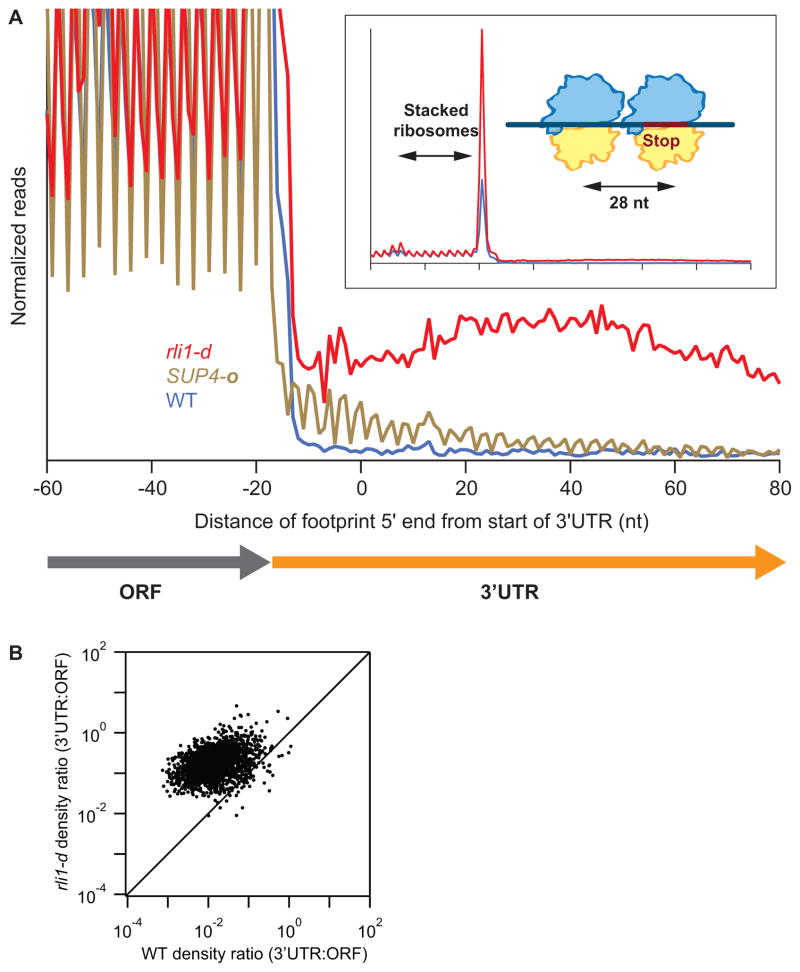
Figure 1. Ribosomes accumulate at stop codons and in 3′UTRs of most genes when Rli1 is depleted.
(A) Normalized average ribosome footprint occupancy (each gene equally weighted) from all genes aligned at their stop codons for WT, SUP4-o (genes with UAA stop codons only) and rli1-d cells. (Inset) Demagnified view of (A) with schematic depicting ribosome stalling and queuing at the stop codon. (B) Ratio of footprint densities in 3′UTRs to the respective ORFs is plotted for rli1-d cells versus WT cells, for genes with >5 rpkm in ORFs and >0.5 rpkm in 3′UTRs. Each point represents the data for 1 gene.

