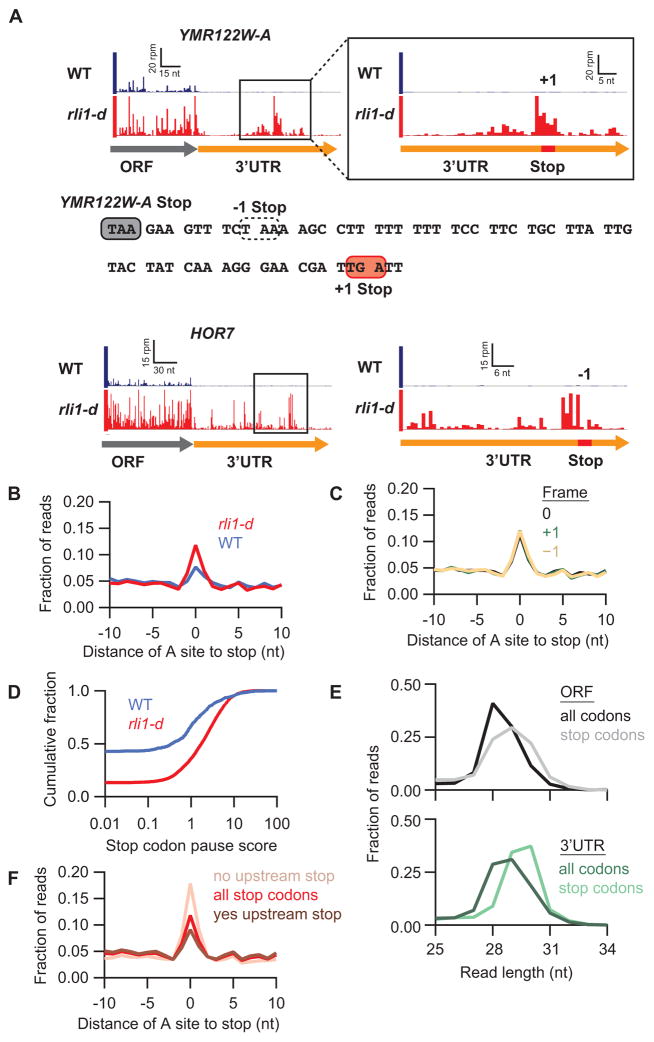
Figure 2. Ribosomes accumulate at stop codons within 3′UTRs in rli1-d cells.
(A) Ribosome footprints on genes YMR122W-A and HOR7. Boxed regions on the left are magnified on the right, showing schematically the positions of 3′UTR stop codons (red) in the indicated reading frames (+1 or −1). A portion of the YMR122W-A 3′UTR sequence is shown, highlighting the main ORF stop codon (filled grey box), −1 stop codon (dotted box), and the +1 stop codon showing a strong 80S peak (filled red box). (B) Average fraction of ribosome occupancy in a window surrounding stop codons in the 3′UTR (all frames included). (C) Same as rli1-d data in (B) but sorting data for each reading frame relative to the main ORF (0) frame. (D) Cumulative frequency histogram of pause scores on 3′UTR stop codons shows enhanced pausing in the rli1-d strain vs WT, for genes with >10 rpkm in 3′UTRs. (E) Size distributions of rli1-d footprints that mapped without mismatches to either spliced coding sequences (ORFs) or 3′UTRs. Mapping performed for full sequences or 34-nt windows starting 17-nt upstream of stop codons. (F) Same as rli1-d data in (B) but data are sorted by the presence or absence of an upstream, in-frame 3′UTR stop codon.

