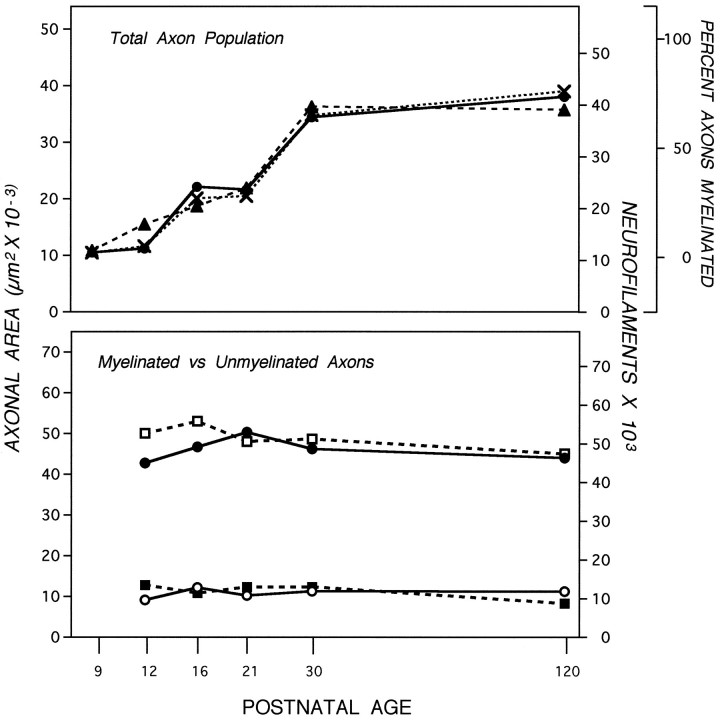
Fig. 4.
Effect of myelination on axonal area and neurofilament accumulation. Top, The cross-sectional areas of axons at the 700 μm level (filled circles), the percentage (X) of myelinated axons (see Fig. 3), and the number of neurofilaments (filled triangles) in the total population of axons was determined. The cross-sectional areas (μm2) of myelinated (filled circles; n = 3632) and unmyelinated (open circles; n = 6098) axons were determined from electron micrographs at 20,000× (bottom). Neurofilament numbers in 829 myelinated (open squares) and 1676 unmyelinated (filled squares) axons of caliber sizes representative of the total optic nerve population were determined at the 700 μm axonal level, also included (bottom). SEs are negligible (see Fig. 3). At all postnatal ages, the neurofilament numbers and axonal areas between myelinated and unmyelinated axons differ significantly (Wilcoxon/Kruskal–Wallis, p = 0.01–0.001).

