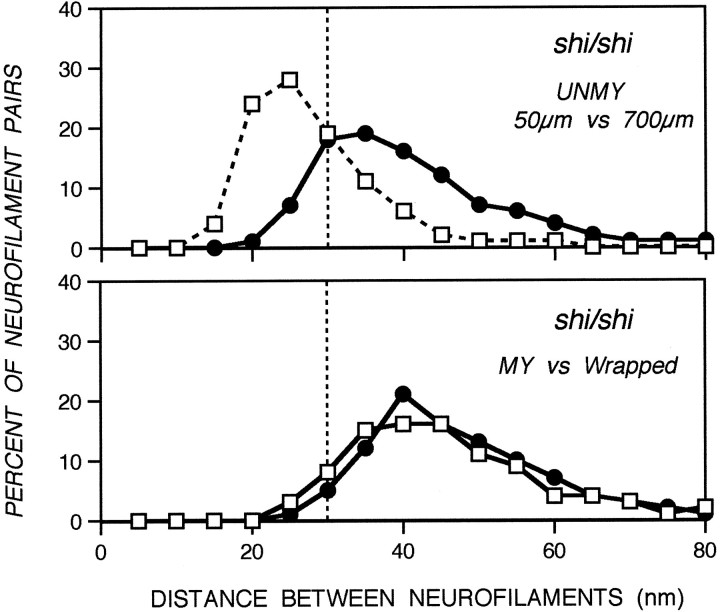
Fig. 9.
Nearest-neighbor analysis of interneurofilament spacing in axons from myelination mutants. Neurofilament pairs (912–2580) were analyzed from 25 axons representative of the total axonal population for the shiverer mutant at different optic nerve levels. Data points indicate the percentage of neurofilament pairs within a specified distance range from their nearest neighbor. Neurofilaments in axons wrapped by oligodendrocyte processes, but devoid of myelin, display the same interneurofilament spacing as those in myelinated axons (Tukey–Kramer test, p < 0) (see Materials and Methods).

