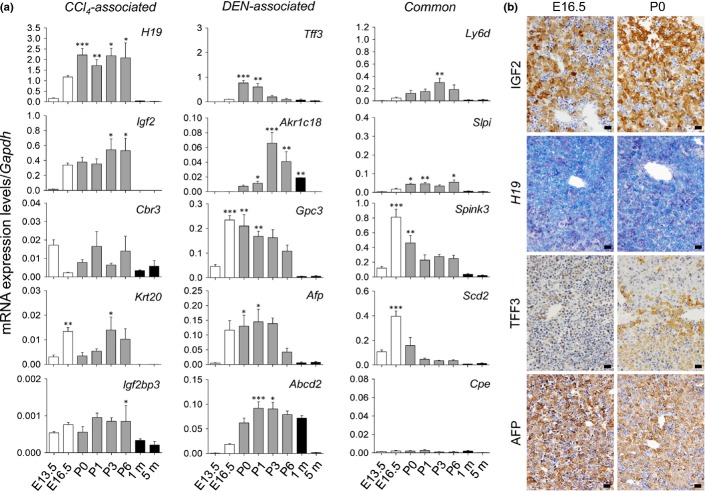
Figure 4.
Fetal/neonatal activation of tumor-associated genes and their products. (a) Quantitative RT-PCR analyses of mRNA expression of tumor-associated genes during fetal/neonatal periods. Each value is expressed as the mean ± SEM. The number of samples in each group was 3, 5, 7, 10, 4, 4, 4, and 7 for E13.5, E16.5, P0 (immediately after birth), P1 (1 day after birth), P3 (3 days after birth), P6 (6 days after birth), 1 m (1 month old), and 5 m (5 months old), respectively. *P < 0.05, **P < 0.01, ***P < 0.001 versus control (5 m); one-way factorial anova. (b) In situ detection of insulin-like growth factor 2 (IGF2), H19 mRNA, trefoil factor 3 (TFF3), and α-fetoprotein (AFP) in developing livers. Immunohistochemistry for IGF2, TFF3, and AFP and in situ hybridization for H19 mRNA in fetal (E16.5) and neonatal (P0) livers. Scale bar = 20 μm.

