
Figure 5.
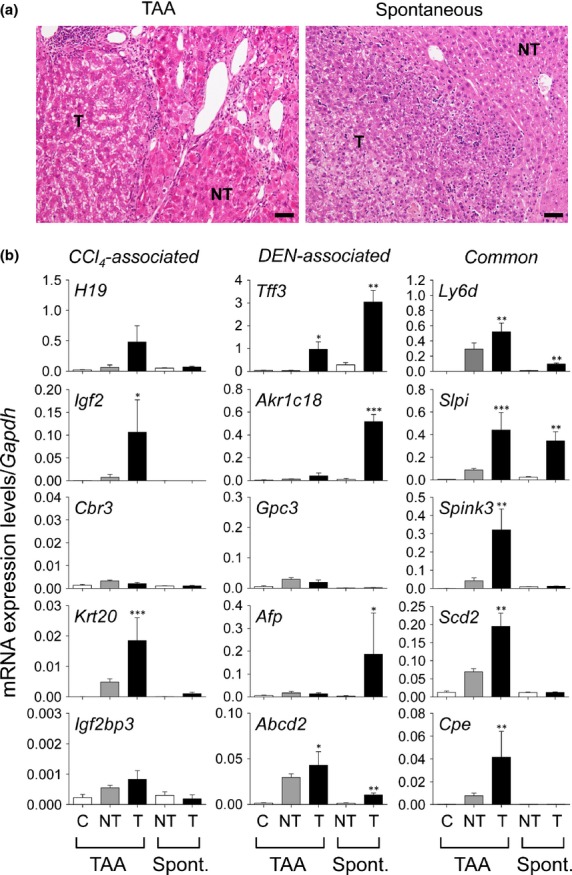
Differential gene expression in thioacetamide (TAA)-induced liver tumors and spontaneously developed liver tumors in mice. (a) Histology of liver tissues from TAA-induced and spontaneous tumors. The ages of mice at analyses were 38–40 weeks and 13–15 months in the TAA-induced model and spontaneous model, respectively. HE staining. NT, non-tumor; T, tumor. Scale bar = 50 μm. (b) Quantitative RT-PCR analyses of mRNA expression of 15 tumor-associated genes in TAA-induced and spontaneous (Spont.) tumors. Each value is expressed as the mean ± SEM. The number of samples in each group was 7, 6, 9, 4, and 3 for the TAA control (C), TAA-induced cirrhosis (NT), TAA-induced tumors (T), control C3H mouse liver (NT), and spontaneous tumors (T) in C3H mice, respectively. *P < 0.05, **P < 0.01, ***P < 0.001 versus control; one-way factorial anova.