
Figure 7.
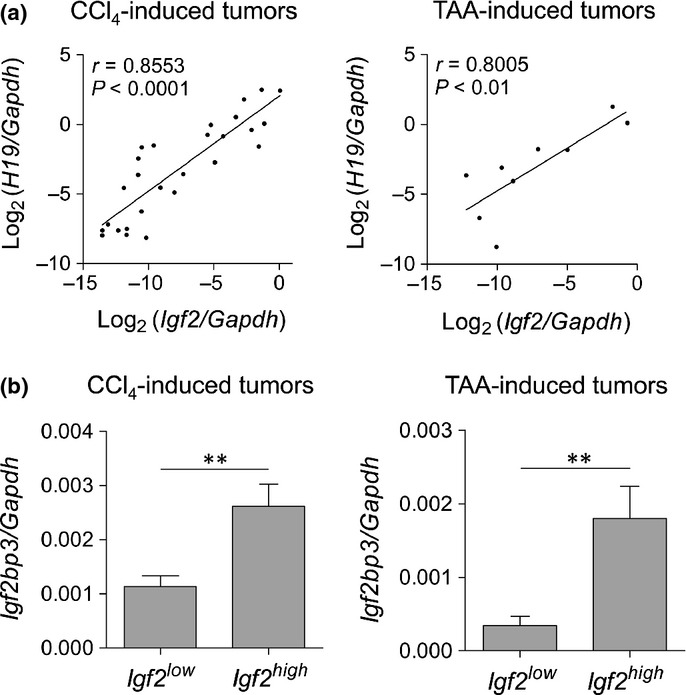
Association between mRNA expression of Igf2 and its related genes in CCl4- and thioacetamide (TAA)-induced tumors. (a) Scatter plot showing a positive correlation between the mRNA expression of Igf2 and H19 in CCl4-induced tumors (n = 27) and TAA-induced tumors (n = 9). Spearman’s correlation coefficient was used to test the correlation between the expression of the transcripts. (b) Igf2bp3 mRNA expression in tumors with substantial Igf2 mRNA expression (Igf2high, Igf2/Gapdh ≥0.01; CCl4-induced tumors, n = 12; TAA-induced tumors, n = 3) and very low or no Igf2 mRNA expression (Igf2low, Igf2/Gapdh <0.01; CCl4-induced tumors, n = 19; TAA-induced tumors, n = 6). **P < 0.01; unpaired two-tailed t-test.