Fig. 2.

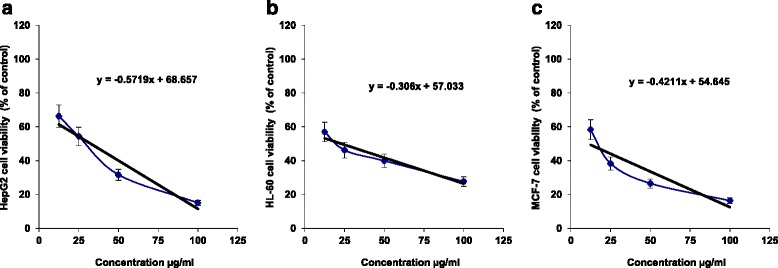
The cytotoxicity (% of control) of different concentrations (μg/ml) of the tested sample against (a) human HepG2, (b) human HL-60 and (c) human MCF-7 cells after 24 h of incubation as assayed by MTT. (n = 4)

The cytotoxicity (% of control) of different concentrations (μg/ml) of the tested sample against (a) human HepG2, (b) human HL-60 and (c) human MCF-7 cells after 24 h of incubation as assayed by MTT. (n = 4)