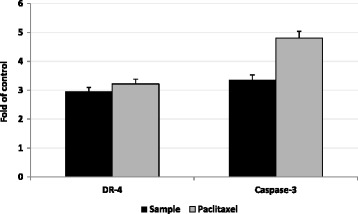
Fig. 6.

The effect of treatment with the tested sample (black bars, 50 % of IC50) on apoptotic cell death pathway in MCF-7 cells compared with paclitaxel activity (gray bars). DR4 and caspase-3 levels in treated cells were compared with control cells. The data represented as number of folds in relation to control absorbance readings, which were 7.3, and 6.5 milliabsorbance, respectively
