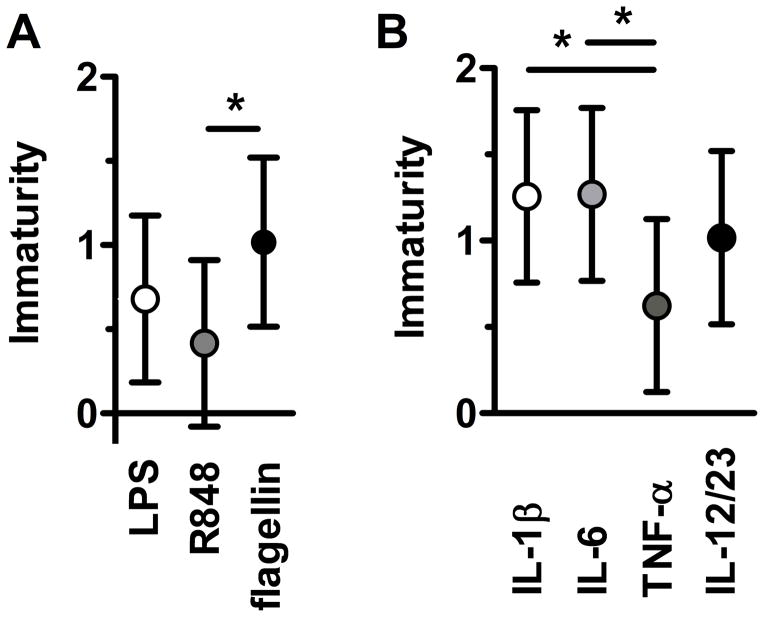
Figure 2. Developmental Hierarchy in neonatal TLR responses maturation.
Degree of immaturity (expressed as the difference in mean [term – preterm] area under the curve of each responses on the log(x + 1) scale) in (A) TLR ligand-specific or (B) cytokine-specific responses between term and preterm neonates with 95% confidence intervals (bars); *p<0.05 for maturation effects after adjusting for multiple comparisons (see methods for details).

