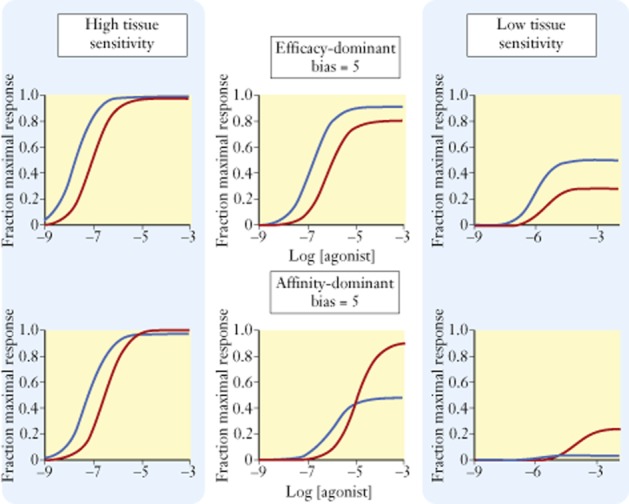
Figure 6.

Effects of reduction in receptor density in various systems on two types of biased agonist. In the top row, the bias, fivefold for pathway 1 (blue line) is due primarily to a selective efficacy for pathway 1; pathway 1 τ = 10, KA = 2 μM; pathway 2 τ = 4, KA = 4 μM. Receptor concentrations from left to right panels are [RT] = 10, 1, 0.1; note that the bias towards pathway 1 is maintained throughout all receptor levels. Lower row of panels shows the effect of an agonist with the same bias (fivefold for pathway 1) but resulting from a selective affinity; pathway 1 τ = 3, KA = 2 μM; pathway 2 τ = 30, KA = 100 μM. Receptor concentrations from left to right panels are [RT] = 10, 0.3, 0.01. Note how the bias at the lowest receptor level reverses from pathway 1 > pathway 2 to pathway 2 > pathway 1.
