
Figure 7.
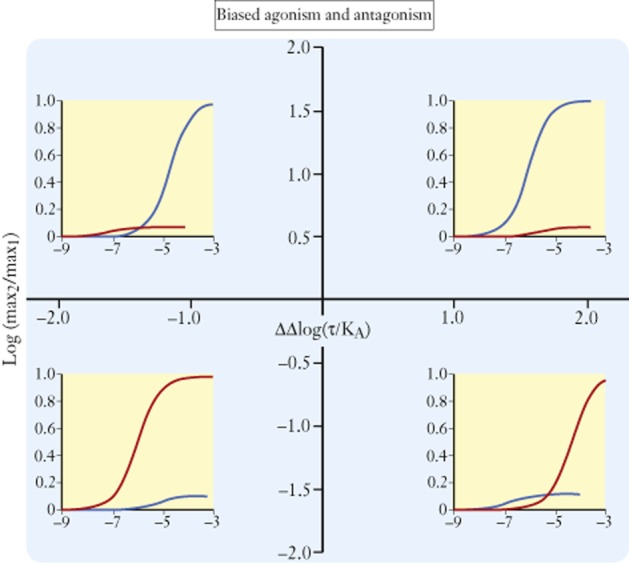
Grid for hypothetical-biased agonists for two pathways drawn as blue and red lines in the concentration-response curves. Ordinates represent logarithms of the relative maximal responses to the agonists for each pathway as a ratio maximum for pathway 2/maximum for pathway 1. Abscissae are logarithms of the bias of the agonists for pathway 2 over pathway 1. Four quadrants are defined. In the upper top quadrant, compounds have a higher efficacy for pathway 2 but are biased towards pathway 1. In the lower right quadrant, compounds have a higher efficacy for pathway 1 and also are biased towards pathway 1. The top left quadrant shows agonists that have a higher efficacy for pathway 2 over pathway 1 and are biased towards pathway 2 as well. The lower left quadrant shows agonists that have a higher efficacy for pathway 1 but are biased towards pathway 2. The abscissal axis (ΔΔLog(τ/KA) indicates the relative concentrations where dose-response curves will appear (when the tissue is sensitive enough to show agonism) when they do appear. The ordinal axis shows the relative ability of the agonists to produce the different pathway responses. Effect on pathway 1, blue curve; effect on pathway 2, red curve.