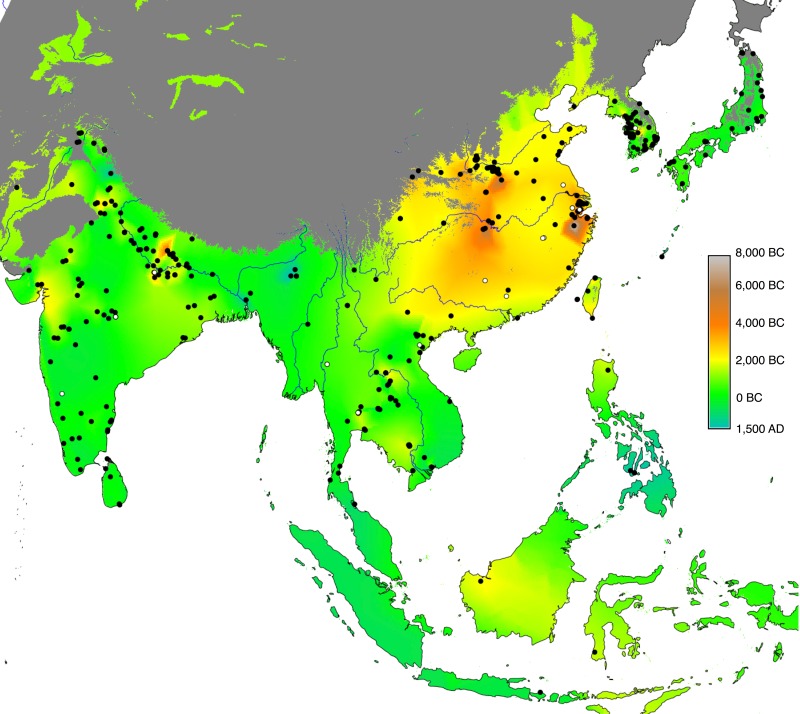
Fig 1. Map of the Rice Archaeological Database version 2.0.
Sites with cultivated rice are shown as filled black dots, whereas open ones represent archaeological sites with wild rice. The background layer shows the quantile interpolation of the median dates for the arrival of cultivated rice. The grey-shaded region has been excluded from the interpolation (see main text). Major rivers have been included for reference (source: ESRI World Major Rivers).

