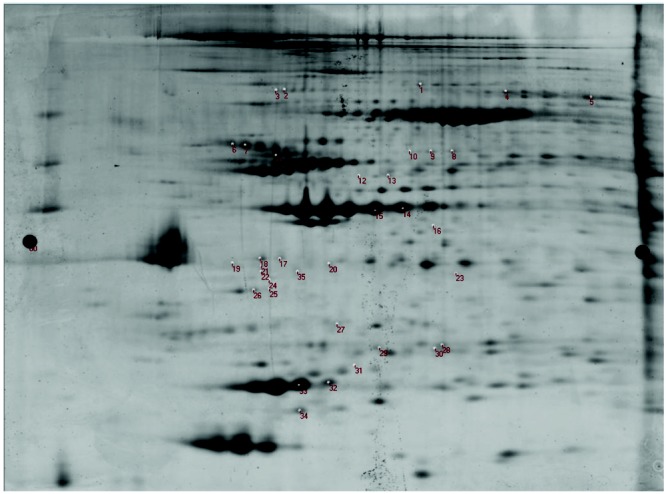
Figure 1.

Two-dimensional (2D) differential in-gel electrophoresis. This figure shows the labeled 2D gel (protein isoelectric point plotted against protein molecular weight in kDa) of left and right ventricular proteins labeled by fluorescent dyes. The numbered positions on the gel represent the proteins differentially expressed in the right ventricle versus the left ventricle and selected for excision, digestion, and identification by tandem mass spectrometry analysis.
